
Executive summary
Universal screening is an essential component of a Multi-Tiered Support System (MTSS) for maths and serves as an early indicator to help identify children with, or at risk of developing difficulties in mathematics.
Screening should occur three times each year for students throughout primary school, to ensure difficulties are identified early before significant achievement gaps are evident.
Screening tools should have strong predictive validity (meaning a score should accurately predict difficulty on future maths assessments), reliability (of equivalent assessments, for example), brevity, ease of use, and availability of normative data (to compare student achievement against typical achievement for age and grade level).
Curriculum-Based Measurement (CBM) is an effective tool to use for screening in maths. CBMs are brief (less than 10 minutes) timed measures which serve as an indicator of progress towards long-term maths goals.
CBMs usually have two components: fluency, and concepts and applications. Fluency measures computational and/or procedural fluency, which research has demonstrated is necessary for students to access more complex skills and concepts in maths. Concepts and applications measures are derived from curriculum content considered to be most crucial for grade-level proficiency.
Although screening and intervention processes associated with MTSS models are only beginning to be used systematically in Australia, considerable support exists for teachers to choose and use such tools in the US. The National Center for Intensive Intervention (NCII) is one such support agency, which helps teachers and schools make informed decisions about available screening and intervention tools.
CBMs have standardised procedures for administration which vary between tools. These should be followed with fidelity to ensure conclusions are accurate. All students, including those with diverse needs, benefit from CBM as a way to monitor current achievement and progress according to grade-level expectations.
Data from CBMs should be analysed with reference to grade-level norms to establish if support needed is targeted (achievement 10th-25th percentile) or intensive (achievement below 10th percentile). Students receiving intervention should have their progress monitored weekly using CBM to ensure adequate progress is being made.
CBM is a robust and reliable approach to use for screening. Effective use of CBM for screening and progress monitoring can result in improved outcomes for students through early and meaningful intervention.
Overview of screening in maths
Maths screening is preventative in nature, with a focus on identifying maths issues early, prior to escalation of risk. The primary goals of this paper will be to present information on the following key aspects of high-quality maths screening: what it is, what it’s used for, what key skills are assessed, and how schools can select appropriate tools and implement screening.
It also will explain how to use screening data to make better decisions about student risk status.
Definition and purposes
Screening in maths is the process of utilising an efficient and robust assessment tool to briefly check all students in a grade or in a school for their degree of risk of poor end-of-year outcomes. This grade-wide or school-wide process is often called Universal Screening and is an integral part of a Multi-Tiered System of Support (MTSS) framework (see CIS Analysis Paper 73, Learning Lessons: The future of small-group tutoring for more about MTSS).
In an MTSS model, screening data from all students is utilised to determine who is on track to meet long term goals in maths, and who is in need of additional support. In this way, maths screening data is utilised for students in Tier 1 to determine who might show signs of maths risk, and for students in Tiers 2 and 3 to determine if risk remains after a period of instruction and intervention — and to what degree this risk has been remediated or has grown. When thinking about how universal screening is situated within an MTSS model, we often think of universal screening occurring three times per year (beginning, middle, and end of school year) while Tier 1 (class wide, or school-wide instruction), Tier 2 (targeted intervention, small group), and Tier 3 (individualised intervention) are also occurring.
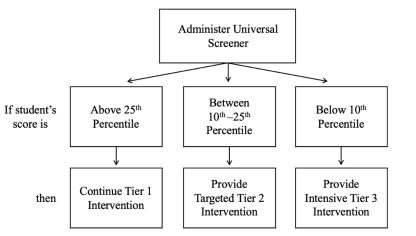
Screening assessment is administered to all students within a classroom. It must happen early in the academic year to identify at-risk students early enough to intervene before they fall too far behind expected levels, and then at the midpoint and end of the year. Early screening will allow educators to determine if there is a class wide need (Tier 1), a small group need (Tier 2), or an individualised need (Tier 3) based on the results (see Data Utilisation section for more information on determining the level of need).
Screening in maths can be compared to other health screeners like checking weight using a scale, checking blood pressure, or taking one’s temperature. All these health screeners provide a check on health risk while maths screeners provide a sense of a student’s academic health. When educators utilise reliable, valid, and efficient assessment systems as screeners, they can identify students earlier who might be at-risk in maths, thus allowing for intervention to be delivered in a timelier manner.
Early intervention is clearly linked to stronger maths outcomes. A robust screening framework informed by data is important because educators need to be able to make decisions about student performance that are accurate and in which they can have confidence. Educators have to be expedient when considering student needs in maths and how they can support students who are not on track to meet maths outcomes. Reliable data is needed that provides greater and better information than just using their judgment, reliably informing decisions about next educational steps.
Characteristics of good screeners
As educators consider the measures they can utilise for screening, they should consider sources that are evidence-based. The term ‘evidence-based’ refers to sources that base their rationales on high-quality research findings that show significant effects on improving student or other relevant outcomes according to evidence from at least one well designed and well implemented study. There are different strengths of evidence (i.e., strong, moderate, and promising) which are indicative of what kind of study was conducted (i.e., experimental, quasi-experimental, or correlational, with statistical controls for selection bias respectively) (Every Student Succeeds Act, USC, 2015).
Characteristics of high-quality screening tools include ease of use (administration, scoring, cost, training), high accuracy in predicting success on the outcome of interest, can be easily linked to instruction, and provide precision in distinguishing students who might develop difficulty in the target area. Additionally, strong screening measures include those that are reliable and valid — reliable in terms of eliciting a result that would be similar from week to week, with fluctuations only occurring due to student progress, and valid meaning that the measures truly capture what they purport to measure.
While measures may be developed locally, the best measures are those that are created and validated by research in order to collect data on many users and then use statistical analysis to determine how the measures are functioning. These large-scale samples provide the opportunity for validation of measures at a level that wouldn’t be possible with local samples.
To summarise, screening measures should have several characteristics, prioritised as follows: strong predictive validity (meaning a score should accurately predict difficulty on future maths assessments), reliability (of equivalent assessments, for example), brevity, ease of use, and availability of normative data.
Using curriculum-based measures as screeners
In high-quality MTSS models, the best screening tools are those that have the characteristics that align with Curriculum-Based Measures (CBM). CBM is a system of screening and progress monitoring in academic areas that utilises evidence-based measures to assess performance and progress. In basic terms, CBMs are brief (typically no more than 10 minutes in maths) measures that are administered to students three times per year for screening purposes, or once per week for progress monitoring purposes.
Teachers then use the scores from these measures to compare to normative data to determine if the current maths program is meeting students’ needs. These brief, reliable and valid measures serve as broad indicators of maths performance, meaning that they provide an indication of how a student is performing overall and as compared to long term maths outcomes. This use of CBM for screening provides efficient and precise data with which to make decisions, as compared to more lengthy screening tests, such as individual interviews, that may take too much instructional time and not provide reliable data (see Box 1).
Box 1: The history of curriculum-based measures as screening tools
When CBM measures were developed in the mid-1970s, the initial framework for teacher data utilisation was termed Data Based Program Modification (DBPM; see Shinn, 2012 for a well-articulated account of this early work). DBPM had roots in teacher development, behaviour analytic techniques, and precision teaching (Lindsley, 1990). Precision teaching included direct and explicit teaching methods, like modelling and precise and frequent feedback using visual models. Deno and his colleague Phyllis Mirkin (1977) brought these components together in a manual that was published by the primary special education agency in the US, the Council for Exceptional Children (CEC).
The DBPM manual detailed methods that special education teachers could use to monitor the performance and progress of their students in basic skill areas. Special education teachers could empirically evaluate the progress of their students and make decisions about their instruction based on actual student performance data. This method differed from past practices where teachers might just guess about when to try something new or make judgments about the effectiveness of an intervention based on anecdotal accounts or personal feelings.
This new way of thinking brought about a more data-based, scientific approach to education. Centred around a problem-solving process (see Marston et al., 2003), DBPM provided a model to assist teachers as they identified an area of need, developed an intervention, monitored the progress of the student in the intervention, and then continued or modified the intervention after examination of data at regular intervals. This basic model is now termed Data-Based Individualisation (National Center on Intensive Intervention), Prevention Science (i.e., see Lembke, McMaster, & Stecker, 2009), or Response to Intervention (RTI).
CBM draws upon research support for automaticity and fluency, with a focus on development of measures that serve as indicators of broad constructs, such as mathematics proficiency. In the area of mathematics, Rhymer et al. (2000) cites literature that suggests that computational fluency, defined as responding accurately and rapidly, leads to better long-term outcomes such as longer-term maintenance of skills and better application to novel mathematics tasks. The US National Mathematics Advisory Panel (2008) suggests that mathematical fluency includes both computational and procedural fluency. Clearly, there is a common theme throughout these reports and manuscripts indicating that rapid naming of facts and the ability to quickly apply procedures are critical to developing further mathematics skill. In their article on computational fluency for high school students, Calhoon et al. (2007) cite work demonstrating the far-reaching influences of fluency. For instance, The US National Research Council (2001) provides an analogy suggesting that lack of computational fluency may have negative effects on mathematical comprehension similar to the effects that poor decoding has on reading comprehension (in Calhoon et al., 2007). In addition, Calhoon and her co-authors provide an overview of the literature suggesting that higher order mathematics cannot be accessed as efficiently if fluency is not present.
CBM measures embody specific characteristics, including: (a) efficient administration, (b) short duration, (c) technical adequacy (i.e., reliability and validity), and (d) indicators of academic proficiency. The term indicator is used to signify the short duration of the measures as well as their strong relation to other measures of broad academic proficiency in that content area.
Utilising the research base that supports fluency, we can develop brief measures that serve as proxies for overall academic proficiency. Thus, although a common measure of CBM in maths is the number of correct problems answered in one minute (computation), this score serves as a broader indicator of academic proficiency in maths (Nelson et al., 2023).
In addition to computational fluency, CBM measures often aim to measure progress against an indicator of grade-level expectations in mathematics, and typically include measures derived from those grade-level skills considered most critical in a student’s curriculum (Stecker et al, 2005). Therefore, although CBM measures do not need to be curriculum specific, measures designed to sample grade-level proficiency should be aligned to appropriate grade level expectations in order to be most useful for decision making. This means that some care must be taken when adopting tools from other education systems where grade level expectations are significantly different.
What skills are assessed?
Most screeners assess two domains: Fluency and Concepts & Applications. These two domains have been demonstrated to be highly related, but still two distinct skills and measure separate constructs (Thurber et al., 2002), therefore it is important to assess them separately.
Fluency. Fluency, generally speaking, is a students’ ability to retrieve information quickly and accurately (Haring, et al., 1978). The goal of building fluency is to help students reduce the working memory needed, typically for number sense and computation, in order for more brain power to be allocated to the new skill.
Concepts and Applications. Concepts and applications or problem-solving measures then measure students’ understanding of grade-level content, which gives educators insight into the students’ knowledge of more complex skills. These skills include number sense, measurement, operations, patterns and relationships, data interpretation, and analysis. These measures are often not timed and therefore do not give educators an understanding of fluency (speed and accuracy), but rather just a measure of accuracy, mastery, and problem-solving abilities.
Maths CBM across the primary years
Early Maths (F-1). The skills assessed in early maths focus on general understanding of maths concepts and number sense. There are many skills that help educators gain an understanding of a young student’s number sense: number naming, magnitude discrimination (knowing which quantity or numeral is more or less), matching quantities to numerals, sequencing, subitising (the ability to quickly assign the correct numeral to a small quantity), cardinality (being able to count how many objects in a set and understanding the numeral represents the amount; numerosity), decomposing/composing, and place value (National Research Council [NCR], 2009). Fluency of number sense can help to differentiate students with, or at risk, for maths difficulties from those that are not at risk (Geary et al., 2012). See CIS Research Report 49, Screening That Counts: Why Australia needs universal early numeracy screening for a detailed discussion of number sense and its measurement for screening purposes. Concepts and applications in the early grades measure the beginning concepts of maths, which heavily rely on specific, discrete skills in isolation (Clarke et al., 2011).
Later Primary (2-6). As students move into later primary, the skills assessed typically include computation fluency and concepts and applications. The use of basic computation is foundational in all mathematics. Students need to master fluency of basic computation in order to progress in other later mathematic skills such as telling time, using money, problem solving, and algebra (Jordan et al., 2009). Similarly to early maths, the concepts and applications measures assess grade- and instructional-level concepts and vocabulary needed for problem-solving in maths. Such measures are ‘portable’ between different education systems where grade-level expectations are similar. Unlike early concepts and applications, later primary concepts and applications focus on more broad-based skills that cover a range of key topics (Clarke et al., 2011).
Considerations for selecting a screener
As broad indicators, CBM can be used to enhance early identification in the screening process and prevent minor learning gaps from becoming significant learning deficits. Some further challenges and limitations that might arise when using CBM in other contexts (e.g., in Australia in lieu of the United States) include availability of resources, technological barriers, adaptation to the educational system and structure, staff training and support, policy differences, and potential unavailability of local normative data for specific assessments. While there might be an identified need for a screener that is provided at pre- and post-test (for instance) that is directly connected to the school curriculum, general CBM screening tools in maths can provide an overview of broad maths skills and how students are performing compared to normative levels, provided they are well matched to grade level expectations. A screener that is more aligned with the local curriculum could provide more detailed information about how that curriculum is functioning in terms of meeting student needs. However, if the screener is not reliable and valid for the purposes of screening, the data collected might lead to inaccurate decisions.
Technical considerations
One must also consider several technical features including: the accuracy of decision-making, predictive validity, and instructional utility of the measures across grades. In certain content areas like early mathematics (see Gersten et al,. 2012), a battery of measures might be considered rather than a single measure to give a more robust picture of the student’s abilities.
Knowing the characteristics of a good screener and how CBM can be utilised for screening purposes can help when determining strong screeners. More importantly, it can help in determining which screener is most appropriate for your classroom or school. Universal screeners should be selected based on those qualities listed in the sections above and how well the researched student population matches yours. This requires researching the screener a bit before use.
When school systems adopt CBMs to use for screening purposes they should feel confident that CBMs are aligned conceptually with traditional achievement tests, which provide an overall idea of a student’s academic ability, rather than direct forms measurement (Fuchs, 2017). Many studies have researched the use of CBMs as screeners and different vendors (e.g., aimswebPlus and Acadience) have made their CBM measures adaptable to screening using composite scores (i.e., a score comprised of scores from multiple measures) (Klingbeil et al., 2023). One study, examining aimswebPlus, did recommend that US school districts looking to adopt this product as a CBM should be sure to validate the vendor-recommended cut scores to ensure it provided the sensitivity and specificity needed. Doing this will allow school teams to determine if the cut scores produce overly-sensitive results. Oversensitivity results in false positives and a large population of students who are determined in need of intervention (i.e., > 25%) (Klingbiel et al., 2023).
Box 2: Potential issues when utilising a computer adaptive tool (CAT)
Some screening tools conducted online use AI technology to personalise the testing experience for each student by presenting different selections of test items based on a student’s performance during the test. These are known as computer adaptive tools (CATs). A brief literature search resulted in very few peer-reviewed publications that specifically compared computer adaptive measures versus curriculum-based measures. So, in the absence of information about these assessments utilised as tools for identification, the following are some considerations.
Articles that might be useful in helping think through the different test formats and pros/cons are Shapiro and Gibbs (2014) and Clemens et al. (2015).
In the literature, one of the biggest cons with some CATs is content sampling and precision at the tails. First, the CAT needs to be designed to pull a representative sample of the content domain. Second, if the item bank isn’t wide enough, the measurement error can be very high at the extremes (and this is particularly problematic when trying to make accurate recommendations for students experiencing difficulty). So this is yet another reason why it is important for administrators to seek out information on technical adequacy, such as the information that can be found in the National Center for Intensive Intervention (NCII) tools charts.
Where CATs can be problematic is when they provide scores and interpretations of subskills/subscales. Given their adaptive nature and vertical scale, students may see only a couple of items (or in some cases no items) in a subskill area but the program estimates their skills in that area regardless.
Using NCII resources to support tool selection
As part of its commitment to the implementation of evidence-based practices for the assessment and instruction of students, the US Department of Education funds the National Center on Intensive Intervention (NCII) to inform the decisions of systems, schools and teachers. The NCII site (intensiveintervenion.org) is one of the best practical resources to access when examining data for measures and making decisions about which measure to use.
Both Progress Monitoring and Screening Tools Charts are assembled by the NCII to provide information regarding technical adequacy, research backing, and procedures. These charts are updated annually with new screening measures as well as with evolving information for existing tools. A user guide for teams to use as they access the tools charts can be found here: https://intensiveintervention.org/sites/default/files/Tools_Chart_User_Guide-508.pdf.
While the NCII has experts who review the measures and provide detailed ratings, it is up to school teams to use the information provided to make the best decisions for their setting and students. The NCII review process is just that — a review. Value judgements about the potential utility of a given tool are up to the user.
To access the NCII’s academic screening tool chart, navigate to their homepage intensiveintervention.org.
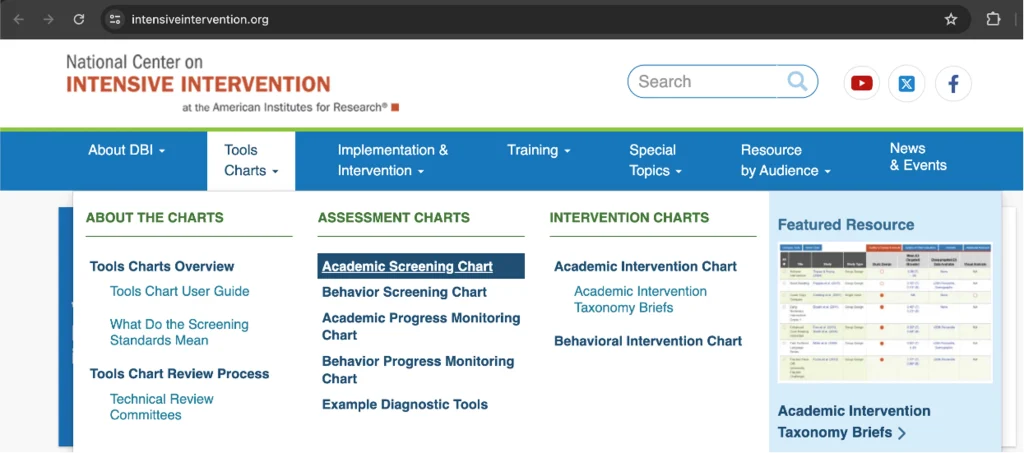
You can access the screening tool chart by clicking on the ‘Tools Charts’ drop-down arrow then clicking on the ‘Academic Screening Chart’:
You are then taken to the academic screening chart where all the information has been consolidated and summarised for three areas on the technical rigour of the screeners: (1) classification accuracy, (2) technical standards, and (3) usability features. Analysing these three areas for multiple screeners will help educators decide on a strong option for their classroom or school.
The tab that covers classification accuracy summarises the evidence on how well a screener can identify students at risk versus those not at risk. NCII summarises the data at three different time points: Autumn (beginning of the US academic year), Winter (mid academic year), and Spring (end of academic year).
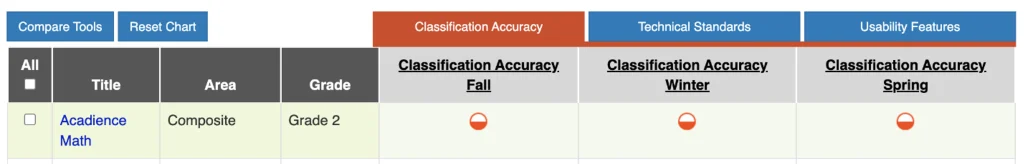
Additionally, there is information listed about the classification accuracy by grade-level. To view this, click on the bubble and a new screen will pop up.
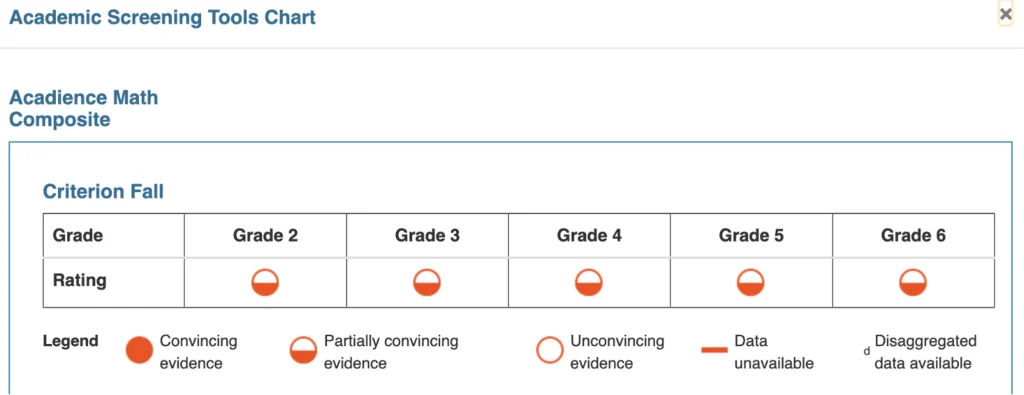
The NCII generates a rating of each screener regarding the strength of the evidence that it can identify the at-risk students from those not at risk: convincing evidence, partially convincing evidence, unconvincing evidence, or data unavailable (see the user guide linked above for more details on these rankings). When choosing a screener, you should avoid the screeners that have no data available or those with unconvincing evidence backing them, for these are the weak screeners that are not successfully identifying the students at risk.
When researching this part of the screeners, aim for half or full bubbles indicating convincing or partially convincing evidence that the screener will correctly identify students that are at risk and those not at risk. Determine the time points your classroom or school wishes to use screeners. Once you have this settled, then it would be beneficial to use the classification accuracy tab to determine the strongest screener for you, based on those desired data collection time points.
The second tab is called technical standards. This tab displays information about reliability and validity, two important technical measures discussed earlier. Similarly to the other tab, technical standards use the ranking system from convincing evidence to evidence unavailable.
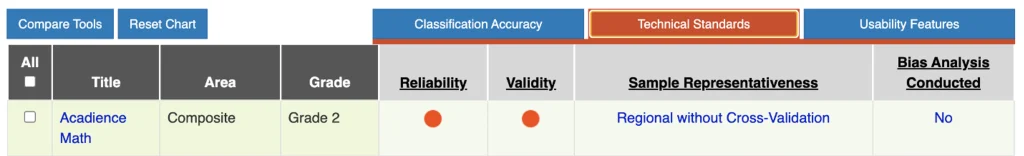
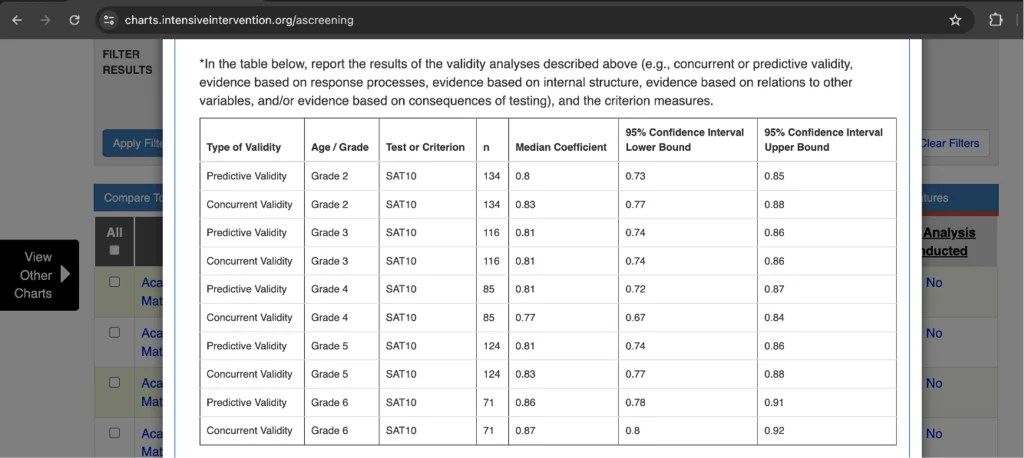
To view the particulars for each screener’s reliability and validity, click on the bubble within the row. After clicking on the bubble, NCII disaggregates the reliability or validity for each grade specifically. Additionally, this pop-up will show the results of the different types of reliability (e.g., alpha, test-retest, etc.) or the types of validity (e.g., concurrent or predictive).
As before, to select the strongest screener for your classroom, aim for the full or partially full bubbles for both reliability and validity. This will ensure that the screener is accurately and consistently measuring the skills it says it is. Additionally, to ensure an even greater match, you can compare your population to the sample representativeness of the screener.
It is important to note that your population does not need to be an exact match to the sample used for the screener to accurately measure your students’ knowledge, but a total mismatch could potentially cause the screener to not be accurate. To ensure the screener’s accuracy for your intended grade level(s), check your local grade-level expectations against US Common Core grade-level expectations for similarity.
The third tab is called ‘Usability Features’. This section gives an overall picture of the procedures of the screener. It lists how long the screener takes, who can administer it, how it is scored and how administrators are asked to make decisions with their data. This section will allow you to determine if you have the right resources available for a specific screener.
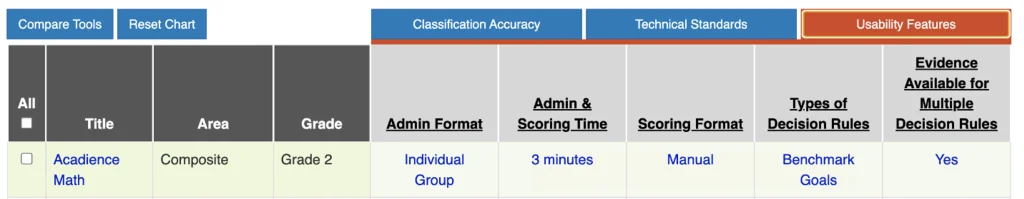
There is no one thing to look for within this tab that will separate the strong from the weak screeners. This section requires discussion and understanding of your own resources to determine which screener is best for you.
Taken altogether, this information can help educators determine which screeners would be a strong fit for their needs. The process requires educators to know their needs and resources beforehand. The user guide linked above can help guide educators in determining what their needs are and how to use the chart to find the best screener.
Practically speaking, it is important for school teams to consider resources available and the time and money they would like to dedicate to screening. The NCII has summarised information on cost and time for administration on their tools charts (https://charts.intensiveintervention.org/ascreening). Information can be accessed by clicking on the name of the measure. Teams should consider selecting a measure that meets their needs for the subject matter, grade level, and use they are considering. For instance, if a school wants to implement screening in maths and already has measures in reading, using the same publisher might make sense. If a school wants to try screening in an academic area that they have not attempted before, they might consider a free or low-cost set of measures to start.
The time for administration is a key consideration. Screening measures serve as indicators of academic proficiency and should be able to be administered in a relatively short amount of time. Each measure should be between 1 and 10 minutes ideally. A detailed description of three well-validated tools in wide use in the USA is in the Appendix.
Box 3: Checklist for decision-making around screening
As school leaders learn more about measures and are able to make more informed choices, greater attention can be given to how to allocate resources for screening tools. Some common questions that should be considered when selecting maths screeners include the following:
-
-
-
- How will the screening data be used?
- Is the screener reliable and valid for the intended use?
- What is the cost of the screening tool compared to the utility? For instance, if this is the first time implementing maths screening, a school may want to pilot a free or low cost screener with a small group of students to get a sense of implementation concerns.
- How long does it take to complete?
- How is the data gathered, where is it stored, and how easy is it to access?
- Who needs to be trained to administer the screening tool and how difficult is it to train?
- How are the assessment results presented?
- What level of ongoing support is required?
- Can the screening tool be used across grades and subject areas?
- Does the tool correctly classify students into the correct ranges according to their skill levels and are students from a variety of backgrounds and programs accurately represented (for instance, students with disabilities and English Learners)?
-
-
Making screening work in practice
Once the correct tool(s) have been selected, we turn our attention to how to implement this with fidelity in the complex environment of a school. All students should be screened using CBM measures, ideally, three times per year (beginning, middle, and end of the school year). Universal screening means that all students in a school are screened. Typical measures used for screening are short-duration tasks that provide an understanding of how students’ performance matches against same-aged peers for the purposes of ranking and determining underachievement through cut scores and benchmarks articulated through norms.
These norms are developed as a result of national, state, or local data collection and translated into benchmark levels of performance that are standard criteria where students need to be performing to be deemed ‘not at risk’ at a particular time of year. The criteria that determine risk status are determined statistically after examining data that has been collected for each grade at each time of year. Students who fall below a predetermined benchmark on the CBM are identified as needing additional instruction or interventions and their progress will be monitored more frequently.
This section will describe the process of screening from start to finish, beginning with planning screening, conducting screening, and analysing and acting upon results.
Being intentional about the logistics is important so the process is standardised from one administration to the next, and to ensure data can be used to inform decision-making about students at risk.
Planning screening
Frequency
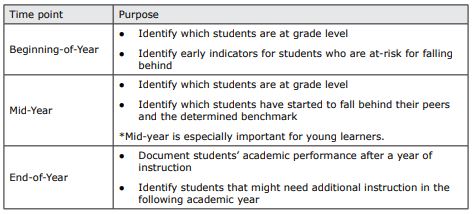
Universal screeners can be administered between one and three times per school year. Each administration can add to the picture of student learning and growth. Administration schedules and purposes can be found in the table below.
To be able to make accurate decisions from year to year, administration should happen at around the same time each year. Students within the same cohort should be screened as close to the same time as possible.
Table 1: Purpose of screener administration by time point
Coordination
There are several strategies that can be employed to complete universal screening with the entire school, at the classroom level, at the grade level, or at the school level. The three are described below, including advantages and disadvantages.
Classroom Level
When a universal screener is administered at the classroom level, the teacher is the examiner, and they work with their own students. The screening happens over one week. Teachers take some portion of the day to assess a small number of students over multiple days until they have assessed their entire classroom (for example, screening five students per day over five days for a total of 25 students assessed). The advantage of this strategy is that the teacher works with their own students, which allows them to gain a deeper understanding of their abilities.
The disadvantage is that more resources are needed to allow the teacher time away from the whole class instruction to work with these individual students. Another disadvantage is this strategy takes multiple days to complete and variation between administration/different classes means more room for variability in both administration and scoring of data.
Grade or School Level
When a universal screener is administered at the grade or school level, trained examiners assess the students, systemically working through the grade level or school. These examiners might be drawn from existing school staff, e.g., specifically trained leaders, classroom teachers or education assistants who are released from other responsibilities, or casual staff trained up by the school (regular relief teachers). Depending on the resources available and school characteristics, this could happen all in one day, or over multiple days.
The advantage of this strategy is that the classroom instruction is less likely to be interrupted since examiners are the ones working with students. Another advantage is that the screener can be completed in fewer days and can provide cleaner and more consistent data. The disadvantage is that it could take significantly more resources to train a group of casual examiners who travel from class to class to conduct the screening.
Conducting screening
Procedures and timing
Each assessment has its own administration and scoring procedures that outline the exact steps an examiner should follow. Following these procedures exactly ensures that the measures are given with high fidelity. When an assessment is given with high fidelity, we can assume that the results are valid, and we can draw accurate conclusions from them (Reed & Sturges, 2013).
The timing of the individual measures will be dependent on the procedures laid out in the administration and scoring procedures of the assessment. It is important to follow these procedures to gain an accurate understanding of the students’ knowledge and skills. This is especially important in the fluency measures because fluency is measured by the speed and accuracy with which a student can perform a skill. The timing piece is a crucial element to determining the speed.
A suggestion for keeping timing of the individual measures standardised is to use a timer (a stopwatch or countdown timer) instead of keeping track of time on a clock. For certain measures, the precision of timing, to the second, is crucial.
The testing environment
When administering a universal screener, students should be in a quiet room with minimal distractions or noises. Each student should have their own space to work on the assessment, either their own desk, or spaced out at a group table so that students stay focused on their own work.
If the measure is individually administered, the examiner should be sitting close enough to hear their answers, typically recommended to sit across from the student. The examiner should have any procedures or scoring documents on a clipboard faced away from the student so they cannot see what is being written.
Making reasonable adjustments
Students might need reasonable adjustments which would be provided to students when the standardised procedures would produce inaccurate results. Reasonable adjustments will be explicitly stated within the administration and scoring procedures for the assessment and might be termed ‘accommodations’. Schools are encouraged to screen all students, including those with disabilities, as it is important to identify how students are doing compared to grade level performance expectations or national norms. This can give teachers important information about how students are performing, given typical maths problems for their age. Because so much maths curriculum is individualised for students who have maths challenges, it is important to have a clear understanding of how students are performing compared to peers and norms a few times per year in addition to measures which reflect progress on individual learning goals. This can also help support reporting on goals that are written for students on individual learning plans, as it provides a baseline of where students would be achieving if they were on track to meet typical maths outcomes.
Scoring
Scoring the measures should be done by following the procedures outlined by the assessment developers. When scoring happens in real-time, scoring guidelines will help examiners to know when to score an answer as correct or incorrect. Examiners should read over the guidelines ahead of time, so they are prepared to score student answers in the moment. Some platforms administer their measures online. In these cases, the platform will automatically score the students’ answers.
Analysing and acting upon results
For CBM screening, the higher the stakes of the decision, the more important precision in decision-making becomes. For instance, making a decision about student movement to a different tier of instruction in an MTSS model might be higher stakes, and collection of additional follow-up data would be needed to supplement screening. A lower stakes decision that still requires specificity might be determination of small-group intervention activities for a low-performing classroom based on CBM screening data.
Because data is used to make educationally significant decisions, data literacy is important. This includes administering measures, but also understanding the data and for what purpose the measures are administered. Typically, we screen all students in a setting or grade level to identify students who may not be at the level we would expect in a given academic area at a given time of year. How do we use the data? Following are steps in a data-based model for decision making using CBM. See Box 4 for an illustration in the form of a case study.
Using Percentiles for decision-making
Following the administration of universal screening, teams should focus on answering the following questions:
- Which students may need supplemental instruction to reach the grade level content expectations, and
- Which degree of intervention intensity (i.e., universal, targeted, or intensive) does each student need (Project STAIR, 2022). To answer these questions, teams should dedicate time to analysing their data using the following steps:
- Once universal screening scores are obtained using standardised procedures, identify students at risk or underperforming using the data.
- General guidelines indicate that students performing below the 25th percentile (according to national norms) are in need of intervention. This may vary depending on the specific school population.
- For students at risk, determine the level of intervention intensity required.
- Students between the 10th and 25th percentile need targeted intervention (Tier 2).
- Students below the 10th percentile need intensive intervention (Tier 3).
Depending on the universal screening assessment being used, percentile scores might be available in the form of a class- or school-wide report.
Figure 1: Universal Screening Decision Rules Using Percentiles
Hand scoring
If a school team does not have access to national norms for their universal screener, scores can be manually sorted using the steps provided:
- Identify, for each grade, the expected level of performance for the time of year being assessed (e.g., beginning, middle, end).
- In class sets, organise student assessments by score from least to greatest.
- Determine which students in each class met or exceeded the grade level expectation; determine what percent of students in each class did not meet or exceed the grade level expectation.
- If the number of students performing below the grade level expectation exceeds 25%, prioritise addressing Tier 1 instruction with each class as applicable.
- If the number of students performing below the grade level expectation is below 25%, proceed with planning implementation of targeted (Tier 2) and intensive (Tier 3) interventions according to the percentile ranges described above.
After identifying students in need of intervention, scores can be reviewed and analysed to determine student areas of weakness, learning difficulties, and other challenges. This information can be used to match students to evidence-based interventions. Teams should be sure to continue to monitor student performance over time and assess the effectiveness of the intervention, adjusting as needed.
Box 4: Case Study – analysing universal screening data in a primary school
Background. Eagle Primary School conducts universal screening assessments three times a year to measure student progress and identify students in need of targeted intervention. It recently completed its first benchmark assessment of the school year. Two fourth-grade classrooms, taught by Ms Spellman and Ms Yee, are now analysing their screening data in a school data review meeting in order to make instructional decisions.
Classroom A: Ms Spellman’s Class. After inspection, it becomes clear that a significant proportion of students in Ms Spellman’s fourth-grade class are not meeting grade-level expectations in mathematics. The universal screening data indicate that only 45% of students have demonstrated proficiency in core maths concepts for their grade level. This indicates a class-wide problem in maths performance.
Before Ms. Spellman and her school team can begin to address the needs of students who may need more targeted intervention, they must prioritise improving core maths instruction for all students at the Tier 1 level. This includes identifying what the instructional needs are and targeting methods to improve those areas of need.
Methods to improve Tier 1 classroom instruction include ongoing professional development and coaching of teachers (particularly in behaviour management strategies), ensuring alignment and efficacy of core curriculum materials, incorporating evidenced-based practices for teaching (see CIS Analysis Paper 62, Maths Practices You Can Count On: Five research-validated practices in mathematics), and increasing opportunities for students to respond and receive behaviour-specific feedback, among others.
Classroom B: Ms Yee’s Class. Ms Yee is also reviewing the universal screening data for her fourth-grade class. The scores for the majority of students in the class meet or exceed the grade-level expectations, however, the data indicate that about 25% of students performed below expected levels of proficiency on the benchmark in both reading and mathematics. These students need additional support and intervention. Ms Yee, with the help of her school’s student support team, analyses the lowest 25% of scores and categorises students into either targeted (Tier 2) instruction or intensive (Tier 3) instruction groups based on their percentile rankings. Students in both of these categories will receive supplemental instruction to address their needs and will participate in ongoing progress monitoring to assess growth.
Conclusion
Curriculum-Based Measurement, or CBM, is an efficient and effective way of identifying students at risk of not meeting grade-level expectation for mathematics. CBM fulfills two roles within an MTSS framework: for universal screening – across whole cohorts of students to identify risk – and for progress monitoring of students who are receiving targeted or intensive intervention.
CBM is a widely used component of MTSS in the US, where considerable resources exist to support teachers and schools in making appropriate choices about which measures are likely to best suit their needs. However, previous CIS research – see CIS Analysis Paper 73, Learning Lessons: The future of small-group tutoring and CIS Research Report 49, Screening That Counts: Why Australia needs universal early numeracy screening – has pointed to the lack of the systematic use of appropriate screening and progress monitoring tools in Australian education, both of which are critical to successful MTSS implementation.
CBM is a powerful tool for educators to monitor student progress and guide instructional decisions. By regularly assessing students’ performance on key skills, teachers can make accurate decisions about who needs support, what type of support they need and track the effectiveness of interventions over time. Implementing CBM successfully involves selecting appropriate measures, administering assessments with fidelity, and analysing data to inform decisions about instructional supports. When used effectively, CBM not only enhances student learning outcomes but also fosters a data-driven approach to education, ensuring that all students have the opportunity to succeed.
References
Calhoon, M. B., Emerson, R. W., Flores, M., & Houchins, D. E. (2007). Computational fluency performance profile of high school students with mathematics disabilities. Remedial and Special Education, 28(5), 292-303. https://doi.org/10.1177/07419325070280050401
Clarke, B., Lembke, E. S., Hampton, D. D., & Hendricker, E. (2011). Understanding the R in RTI: What we know and what we need to know about measuring student response in mathematics. Understanding RtI in mathematics. Proven methods and applications, 35-48.
Clemens, N. H., Hagan-Burke, S., Luo, W., Cerda, C., Blakely, A., Frosch, J., Gamez-Patience, B. and Jones, M. (2015). The Predictive Validity of a Computer-Adaptive Assessment of Kindergarten and First-Grade Reading Skills. School Psychology Review, 44(1), 76–97. https://doi.org/10.17105/SPR44-1.76-97
Deno S. L., & Mirkin, P. K. (1977). Data-based program modification: A manual. Reston, VA: Council for Exceptional Children.
Deno, S. L. (1985). Curriculum-based measurement: The emerging alternative. Exceptional children, 52(3), 219-232. https://doi.org/10.1177/001440298505200303
EarlyMath English Overview. (2023). FastBridge. https://fastbridge.illuminateed.com/hc/en-us/articles/1260802482769-earlyMath-English-Overview
Every Student Succeeds Act, 20 USC § 6301 (2015).
Fuchs, L. S. (2017). Curriculum–Based Measurement as the emerging alternative: Three decades later. https://doi.org/10.1111/ldrp.12127
Geary, D. C., Hoard, M. K., Nugent, L., & Bailey, D. H. (2012). Mathematical cognition deficits in children with learning disabilities and persistent low achievement: A five-year prospective study. Journal of educational psychology, 104(1), 206–223.
https://doi.org/10.1037/a0025398
Gersten, R., Clarke, B, Jordan, N., Newman-Gonchar, R., Haymond, K., & Wilkins, C. (2012). Universal screening in mathematics for the primary grades: Beginnings of the research base. Exceptional Children, 78(4), 423–445. https://doi.org/10.1177/001440291207800403
Haring, N.G., Lovitt, T.C., Eaton, M.D., & Hansen, C.L. (1978). The fourth R: Research in the classroom. Columbus, OH: Charles E. Merrill Publishing Co.
Jordan, N. C., Kaplan, D., Ramineni, C., & Locuniak, M. N. (2009). Early math matters: Kindergarten number competence and later mathematics outcomes. Developmental psychology, 45(3), 850. https://doi.org/10.1037/a0014939
Klingbeil, D. A., Van Norman, E. R., Osman, D. J., Berry-Corie, K., Carberry, C. K., & Kim, J. S. (2023). Comparing AimswebPlus to the benchmark assessment system for universal screening in upper elementary grades. Journal of Psychoeducational
Assessment, 41(2), 194-208.
Lembke, E.S., Carlisle, A., & Poch, A. (2016). Using Curriculum-based measurement fluency data for initial screening decisions. In K.D. Cummings and Y. Petscher (Eds.). Fluency Metrics in Education: Implications for Test Developers, Researchers, and Practitioners. New York: Springer. https://doi.org/10.1007/978-1-4939-2803-3_4
Lembke, E., & Foegen, A. (2009). Identifying early numeracy indicators for kindergarten and first–grade students. Learning Disabilities Research & Practice, 24(1), 12-20. https://doi.org/10.1111/j.1540-5826.2008.01273.x
Lembke, E.S., McMaster, K., & Stecker, P.M. (2009). The prevention science of reading research within a response-to-intervention model. Psychology in the Schools, 47(1), 22-35.
Lindsley, O. R. (1990). Precision teaching: By teachers for children. Teaching Exceptional Children, 22(3), 10-15.
Marston, D., Mirkin, P., & Deno, S. (1984). Curriculum-based measurement: An alternative to traditional screening, referral, and identification. The Journal of Special Education, 18(2), 109-117. https://doi.org/10.1177/002246698401800204
Marston, D., Muyskens, P., Lau, M., & Canter, A. (2003). Problem‐solving model for decision making with high‐incidence disabilities: The Minneapolis experience. Learning Disabilities Research & Practice, 18(3), 187-200.
National Council of Teachers of Mathematics (NCTM). (1989). Curriculum and evaluation standards for school mathematics. Reston, VA: National Council of Teachers of Mathematics. https://doi.org/10.2307/749544
National Governors Association Center for Best Practices & Council of Chief State School Officers. (2010). Common Core State Standards for Mathematics. Washington, DC:
Authors.
National Mathematics Advisory Panel. Foundations for success: The final report of the National Mathematics Advisory Panel 2008 Washington, DC U.S. Department of Education.
National Research Council. (2001). Looking at mathematics and learning. In J. Kilpatrick, J. Swafford, & B. Findell (Eds.), Adding it up: Helping children learn mathematics (pp. 1–16). Washington, DC: National Academy Press.
National Research Council. (2009). Mathematics Learning in Early Childhood: Paths Toward Excellence and Equity. Washington, DC: The National Academies Press. https://doi.org/10.17226/12519.
Nelson, G., Kiss, A. J., Codding, R. S., McKevett, N. M., Schmitt, J. F., Park, S., Romero, M. E & Hwang, J. (2023). Review of curriculum-based measurement in mathematics: An update and extension of the literature. Journal of School Psychology, 97, 1-42. https://doi.org/10.1016/j.jsp.2022.12.001
Pearson (2018). Development Manual. Bloomington, MN: NCS Pearson.
Powell, S.R., King, S.G., & Benz, S.A. Maths practices you can count on: A guide to five research-validated practices in mathematics. CIS Analysis Paper 62. February 1, 2024.
https://www.cis.org.au/publication/maths-practices-you-can-count-on-five-research-validated-practices-in-mathematics/
Project STAIR. (2020, March 1). How to Interpret Data – Part 1: Screening Data ‖ DBI ‖ GradesK-12 ‖ Project STAIR [Video]. YouTube. https://www.youtube.com/watch?v=HXwvpP61_wQ
Purpura, D. J., & Lonigan, C. J. (2013). Informal numeracy skills: The structure and relations among numbering, relations, and arithmetic operations in preschool. American Educational Research Journal, 50, 178–209. https://doi.org/10.3102/0002831212465332
Reed, D. K., & Sturges, K. M. (2013). An Examination of assessment fidelity in the administration and interpretation of reading tests. Remedial and Special Education, 34(5), 259-268. https://doi.org/10.1177/0741932512464580
Renaissance Learning Inc. (2022). FastBridge Assessments Content Description & Use Guidelines. Renaissance. https://renaissance.widen.net/view/pdf/hfdnkvrrd6/R64613.pdf?t.download=true&u=zceria
Rhymer, K. N., Dittmer, K. I., Skinner, C. H., & Jackson, B. (2000). Effectiveness of a multi-component treatment for improving mathematics fluency. School Psychology Quarterly, 15(1), 40. https://doi.org/10.1037/h0088777
Shapiro, E. S., & Gibbs, D. P. (2014). Comparison of progress monitoring with computer adaptive tests and curriculum based measures. Bethlehem, PA: Center for Promoting Research to Practice, Lehigh University.
Shinn, M. R. (2012). Reflections on the influence of CBM on educational practice and policy
and its progenitor. In C. Espin, K. L. McMaster, S. Rose & M. M. Wayman (Eds.), Measure of success: The influence of curriculum-based measurement on education (pp. 341-356). Minneapolis, MN: University of Minnesota Press.
Stecker, P. M., Fuchs, L. S. & Fuchs, D. (2005). Using Curriculum-based measurement to improve student achievement: Review of research. Psychology in the Schools, 42(8), 795–819. https://doi.org/10.1002/pits.20113
Thurber, R. S., Shinn, M. R., & Smolkowski, K. (2002). What is measured in mathematics tests? Construct validity of curriculum-based mathematics measures. School Psychology Review, 31(4), 498-513. https://doi.org/10.1080/02796015.2002.12086170
Wheeler, C. E., Lembke, E., S., Richards-Tutor, C., Wallin, J., Good, R. H., III, Dewey, E. N., & Warnock, A. N. (2019). Acadience Math. Eugene, OR: Acadience Learning.
Appendix
Universal screening for mathematics in the US: best measures to utilise for maths screening
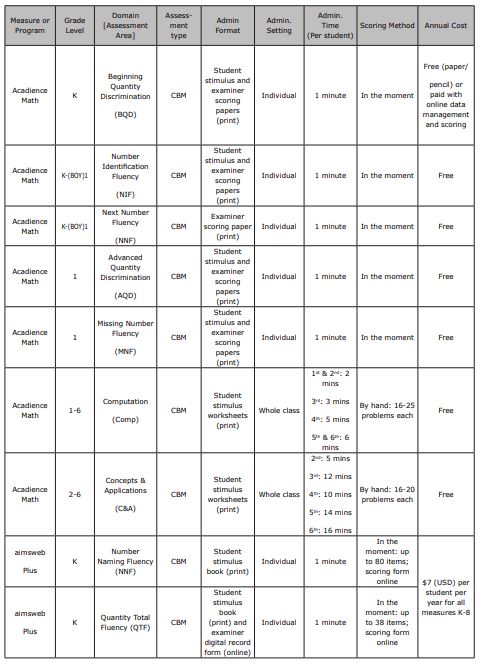
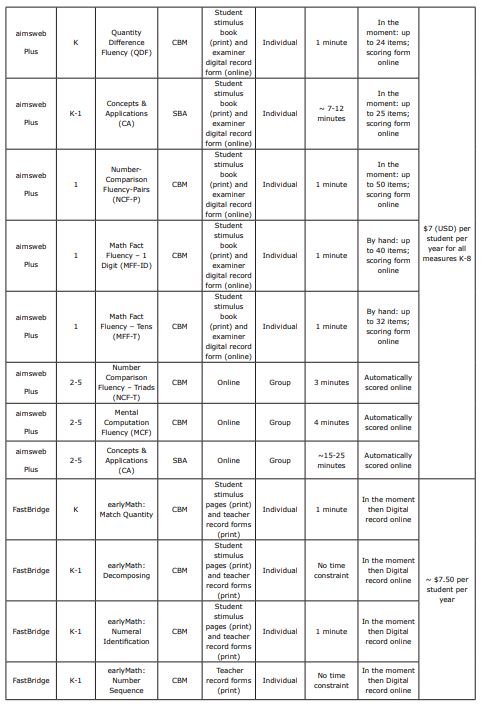
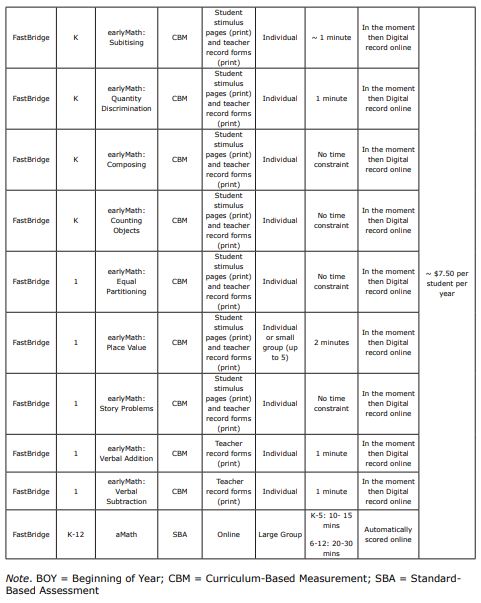
Here are three measures that are commonly used for maths screening in the US. These measures have their strengths and weaknesses, but each of them has data to support their use as a screener in an MTSS model. See Tables 5 and 6 respectively for a descriptive and logistical summary of the three measures described below. Since these measures are from the US, the term ‘kindergarten’ should be interpreted as referring to the Foundation year.
aimswebPlus
aimswebPlus is a completely online assessment, data management, and reporting system. It uses national and local performance and growth norms for both screening and progress monitoring of mathematics and reading for students in kindergarten through eighth-grade to help identify student’s current academic achievement levels (Pearson, 2018).
There are two types of assessments that are used to calculate a student’s performance and growth:
- Curriculum-based measures (CBMs) and
- Standards-based assessments (SBAs, comprehensive measures aligned to current standards). For the purposes of screening as discussed in this paper, CBMs would be the likely choice for schools.
Early Numeracy (K-1)
The early numeracy assessment suite is used to gain insight about kindergarten and first-grade learners’ knowledge and skills about mathematics (as well as reading, but only math is covered in this guide). All measures are timed and administered individually. All fluency measures are one minute in length, whereas the concepts and application measure is about seven to 12 minutes. For a list of each measure in the early numeracy suite, as well as their descriptions, refer to Table 1. These skills encompass the important skills needed for early numeracy, quantity discrimination, counting, and cardinality (Lembke & Foegen, 2009; NRC, 2009). For more detailed information such as administration length, cost, and some scoring guidance, see Table 6.
Table 1. aimswebPlus early numeracy measures and descriptions
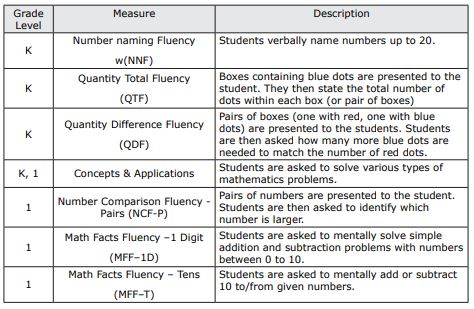
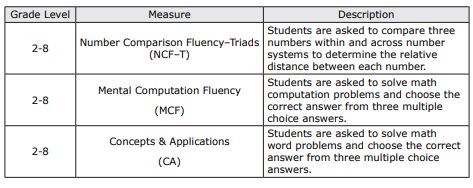
Later Primary (2-5)
There are three measures for the later primary grades (2-8): Number Comparison Fluency – Triads, Mental Computation Fluency, and Concepts and Applications (see Table 2 for a description of each measure). The fluency measures are both timed, whereas the Concepts and Applications measure is not, and therefore could take as long as the student needs. All three measures for grades two through to eight can be group administered online (see Table 6 for more details about administration).
Table 2. aimswebPlus later primary measures
FastBridge
FastBridge is a research-based universal screener and progress monitoring program and has the capacity to look at reading, math, and social emotional behavioural areas. The purpose of this overview is specifically to look at the mathematics section of FastBridge. Its universal screeners for mathematics include earlyMath, specifically designed to be used in pre-kindergarten (K) through first grade, and aMath, for grades kindergarten (K) through 12th-grade. Similarly to aimswebPlus, FastBridge assesses both fluency of number sense and the concepts and their applications.
earlyMath
earlyMath (K-1) is a teacher administered screener typically given three times a year (autumn, winter, and spring) to assess early numeracy skills in kindergarten and first grade. These early numeracy skills fall within three domains of number sense (number, relations, and operations) (Purpura & Lonigan, 2013; NRC, 2009, as cited within EarlyMath English Overview, 2023). Some examples of these early numeracy skills are naming numerals, one-to-one correspondence, and knowledge of symbols in story problems. This teacher administered universal screener takes only between one and four minutes to administer.
The earlyMath screener encompasses 16 subtests. Three of these subtests when combined serve as composite score which is then interpreted as the central data point for determining a student’s risk. Composite scores made up of multiple individual subtests give a more comprehensive view of the students’ abilities and therefore should be used over the individual subtest scores. To see what subtests are included in the composite score for each grade level at different points in the year reference Table 3 (Renaissance Learning Inc, 2022). In addition to the subtests included in the composite score, earlyMath has many other optional subtests. These include skills such subitising, quantity discrimination most/least, composing, counting objects, equal partitioning, verbal addition, and verbal subtraction. All these skills can give educators a clear picture of a student’s number sense development, as mentioned in a previous section (see ‘Skills Assessed’). These additional measures will not factor into the composite scores but can be given during any screening period.
Subtests
Match Quantity. This 20-item, one-minute, and individually administered measure assesses student performance of being able to match a quantity of dots to a number. Incorrect answers are recorded on the evaluator’s copy of the scoring form. The score is determined by the total number correct per minute and recorded in a digital record within the FastBridge platform.
Decomposing-K. The kindergarten version of the decomposition task requires students to demonstrate their understanding of how to take apart fives and tens automatically without using counting strategies. Students are individually given eight items to complete with no set time frame. With each question students are presented with dots arranged in five and 10 frame patterns and are asked, “I ate X. How many are left?”. Using the assessment record on the platform, examiners record the total number of correct responses.
Decomposing-1. The first-grade version of the decomposition task requires students to demonstrate their understanding of ‘parts’ and a ‘whole’, of numbers five to 20, by having them put together and take apart numbers. This is a key skill to understanding later skills. This expects students to orally state the missing part of 24 items, while evaluators mark incorrect answers on their own document, with no set time limit. This is then scored for total number of items correct.
Numeral Identification-K. Kindergarten students are asked to display their capability and fluency in naming numbers through to 31. Students are presented with a page of numbers, organised with easier (numbers 0-9) at the beginning and progressively getting more difficult (numbers 10-31). Test administrators have a page identical to the student. As the student reads the numbers on the page, administrators mark any incorrect responses. This measure is a timed one-minute procedure consisting of 75 items that are then scored for number of numbers named correctly.
Numeral Identification 1. First grade students are asked to identify numbers fluently and correctly to 120. This measure is timed for one minute and consists of 96 items in 16 rows that get increasingly more difficult. Test administrators mark incorrect answers as students read from an identical page. Scores are recorded as numbers are identified correctly.
Number Sequence-K. This 13-item subtest assesses kindergarten students’ ability to rote count orally using the numbers 0-31 as a measure of their understanding of the mental number line. This test requires no additional items (i.e. paper, pencils, physical materials). The number sequence assessment had four different types of tasks it asks students to perform:
- Count Sequence which consists of counting forward and backward
- Name after which requires students to understand number after, one more than, two more than
- Number before asking students to name numbers that are one less than, two less than, and the number before, and finally
- Number between which determines their understanding of the concept of between. Number sequence has no time constraint and students are awarded a score for each correct response.
Number Sequence-1. This 14-item subtest assesses first grade students’ ability to rote count orally using the numbers 0-120 as a measure of their understanding of the mental number line. This test requires no additional items (i.e., paper, pencils, physical materials). The number sequence assessment has four different types of tasks it asks students to perform:
- Count Sequence which consists of counting forward and backward,
- Name after which requires students to understand number after, one more than, two more than
- Number before asking students to name numbers that are one less than, two less than, and the number before, and finally
- Number between which determines their understanding of the concept of between. Number sequence has no time constraint and students are awarded a score for each correct response.
Subitising. The subitising subtest consists of 12 items to determine a student’s ability to distinguish the correct quantity of dots when shown the image for only one second. Tasks included in this measure are subitising and array identification. These activities are meant to be cardinality tasks not counting tasks. The number of dots range from two through six.
Quantity Discrimination. There are two subtests for Quantity Discrimination: Most and Least. Most Discrimination refers to the student’s ability to recognise and select the largest visually presented number between one and ten. Least Discrimination refers to the student’s ability to recognise and select the smallest visually presented number between one and 10. Subtests are comprised of 15 items each, with each item being a row of separate boxes each containing a number. This subtest is given individually and for one minute each, while being scored as correct response per minute.
Composing. During the composing subtest students must demonstrate their ability to put together numbers to create different numbers. This subtest specifically assesses composing pairs of five and 10. Half of the -eight-item test asks how many more to make five while the other half asks how many more to make 10; with four questions per page and each question presented as a row of circles. No time limit is given for this measure, and it is scored as number of correct responses.
Counting Objects. For this measure students are asked to perform two tasks:
- Count the objects, then
- Decide how many. This 10-item individually administered assessment has no time limit and is scored for the number of correct responses.
Equal Partitioning. This -nine-item measure determines a student’s ability to look at two groups of objects and orally convey if they are of equal amount, which has more or less, and separate sets into multiple (two to three) groups. Students are not given a time restriction to complete this activity and test administrators give a score of the number answered correctly.
Place Value. The place value subtest is a 16-item test that is given individually or to a small number of students (up to five). The first half of the items have students examine a group of base-10 blocks and write the equivalent number while the second half of items has students choose the right number of base-10 blocks for a provided numeral. This administration requires each student to have their own copy of the form. The evaluator reads directions to the individual or group and the students attempt to answer as many as possible in two minutes. The examiner then scores each for the total amount of correct answers.
Story Problems. This six-item measure involves both verbal and visual type questions. There are three addition and three subtraction problems. The assessment includes two visual and four verbal story problems. For the visual problems students are presented with a visual at the top of their page and they must determine the correct number expression. The verbal questions are read by the examiner and students are then asked to solve the problem.
Verbal Addition. Addition facts are individually presented to students by the examiner in a one-minute measure to determine their fact fluency. The evaluator records the total number of correctly answered facts in one minute.
Verbal Subtraction. Subtraction facts are individually presented to students in a one-minute measure by the examiner to determine their fact fluency. The evaluator records the total number of correctly answered facts in one minute.
Table 3. Fastbridge subtests included in the composite scores (K-1)

Fastbridge aMath
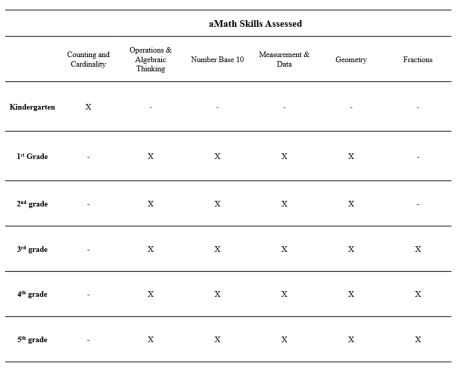
aMath (K-12) is a computer administrated screener focused on measuring both broad and more explicit skills of mathematics. This adaptive measure, consisting of 30-60 questions, is constructed to detect students with math difficulties as well as provide school teams with diagnostic details of students’ understandings and misconceptions. Due to its adaptive nature, aMath selects item difficulty based on student performance. This universal screening is intended to identify student difficulties to give educators an understanding of where to provide support within their instruction (Renaissance Learning Inc, 2022). The skills assessed are documented in Table 4.
Due to the computer administered nature of the assessment, aMath can be given in group format with any number of students. The test itself provides instruction on how to answer questions and how to navigate the system. Students begin with a practice question before the actual questions begin. This test provides audio throughout therefore students are required to have some kind of individual listening capability (e.g., headphones or earbuds).
There are 30 items for every student, therefore it should be feasible for students to complete in one class period. aMath takes an average of 10-15 minutes to complete for students in grades kindergarten through fifth grade. For grades sixth through twelfth, an administration time of 20-30 minutes is average.
Table 4. Skills assessed in aMath for grades K-5
Acadience Math
Acadience Math is a valid, reliable assessment system used for universal screening and progress monitoring of students’ math skills from kindergarten to sixth grade (Wheeler et al., 2019). Printable Acadience Math general outcomes measures (with corresponding scoring keys) are available for schools and districts to download freely. Also available are brief online trainings and a comprehensive assessment manual that includes hand-scoring booklets for benchmark data management, tools for developing benchmark goals, national norms (developed in the United States), cut point scores for determining risk at beginning, middle, and end of year, and assessment fidelity checklists, among other useful tools (See Wheeler et al., 2019). Acadience Math assessments are aligned to the United States Common Core State Standards in Mathematics and consist of measurements for early numeracy, computation, and problem solving (National Governors Association Center for Best Practices & Council of Chief State School Officers, 2010), as similarly described in aimswebPlus and FastBridge. Acadience follows the same domains as aimswebPlus and FastBridge with both fluency and concepts and applications as distinct measures and skills.
Early Numeracy. The Early Numeracy measures included in Acadience Math target the foundational skills students need to develop number sense. These skills include comparing the magnitude of numbers, understanding the effects operations have on numbers, and having significant references for number and quantity (NCTM, 1989), which are all foundational skills for later maths achievement (Jordan et al., 2009). For each of the Early Numeracy subtests, the Acadience Math Assessment Manual provides administration schedules and directions, including discontinue and wait rules.
Beginning Quantity Discrimination (BQD). Beginning Quantity Discrimination is a one-minute, individually administered measure of magnitude comparison for kindergarten. Mental math calculation and place value skills are both associated with magnitude comparison (Gersten et al., 2012). Subitisation, or the ability to immediately determine the number associated with a small set of objects, is also measured indirectly.
Number Identification Fluency (NIF). Number Identification Fluency is a one-minute, individually administered measure assessing students’ ability to orally name printed numbers between 1-99. “Number recognition is essential for later math skills” (Wheeler et al., 2019). In Acadience Math, this CBM is used in Early Numeracy for kindergarten and the beginning-of-year (BOY) first-grade benchmark.
Next Number Fluency (NNF). Next Number Fluency is a one-minute, individually administered measure of students’ capacity to name sequential numerals. This subtest is administered orally, and like NIF, is used in Early Numeracy for kindergarten and the beginning-of-year (BOY) t first-grade benchmark.
Advanced Quantity Discrimination (AQD). Advanced Quantity Discrimination is a one-minute, individually administered measure of magnitude comparison for first grade. This CBM is a more advanced version of BQD.
Missing Number Fluency (MNF). Missing Number Fluency is a one-minute, individually administered measure assessing students’ capacity to count sequences by 1s, 5s, and 10s for first grade. This CBM is a more advanced version of NNF.
Computation (Comp). Computation is a two-six minute (depending on grade level — see Table 6) individually or group administered measure of students’ basic computational skills in math for first to sixth grade. Scores are calculated (by hand) using correct digits in the final answer. In benchmarking, students complete two computation worksheets, and an average score is calculated. There are no discontinue or wait rules.
Concepts & Applications (C&A). Concepts and Applications is a five-16 minute (depending on grade level — see Table 6) individually or group administered measure assessing students’ ability to apply their knowledge, skills, vocabulary, and understanding of concepts to solve math problems for second to sixth grade. Scores are calculated (by hand) using one of three methods (as indicated on the scoring worksheet): correct digits in the final answer, exact answer points per box, exact answer points per line, or exact answer points per segment (Wheeler et al., 2019). As with computation, there are no discontinue or wait rules.
Table 5. Level of Evidence for Selected Universal Screening Measures
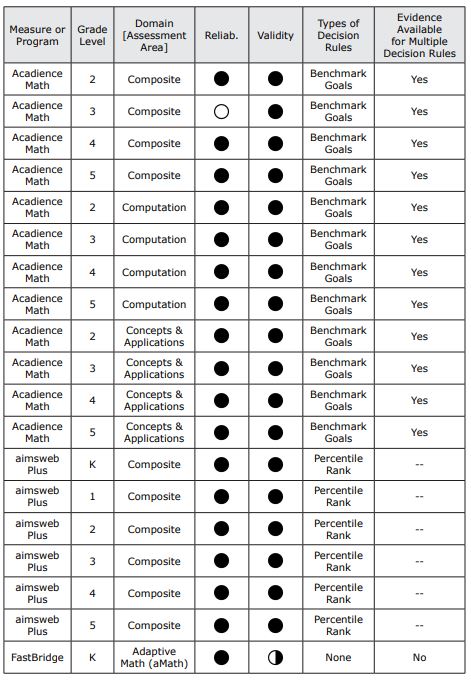
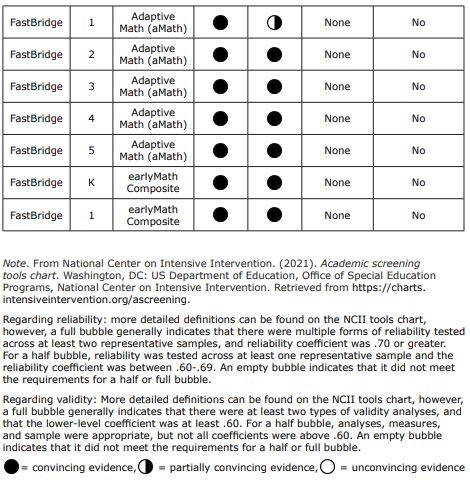
Table 6. Universal Screening Measures, Logistics