
In a nutshell…
Introduction
That government expenditure in Australia has grown apace in recent years is well-known. The growth became gargantuan during the coronavirus pandemic. However, to a less dramatic extent, it was happening before the pandemic — and has continued since it ended.
Some observers welcome this growth to the extent it is a reflection of new spending programs and expansion of existing programs perceived to meet legitimate needs. But it is also a matter of serious concern for reasons that include the implications for higher taxation and public debt, the effect on incentives and the diversion of scarce resources away from alternative and higher productivity activities.
Recently, attention has turned to the impact of higher public spending on inflation as monetary policy struggles to restore inflation to its target. Specifically, the Reserve Bank of Australia (RBA) has spoken of the high level of aggregate demand relative to the economy’s potential output.[i] The RBA has drawn attention to the relatively rapid growth of public final demand as a contributor to excessive aggregate demand — although the Governor has also stated that public sector demand “is not the main game” in the policy response to persistent inflation.[ii]
This policy paper presents the key facts about public expenditure growth in recent years and discusses its contribution to inflation.
What is public final demand?
Public final demand is expenditure on goods and services by all public sector entities, whether they be federal, state or local, or in the general government or government corporation sectors. It is ‘final’ in the sense that it feeds directly into GDP and is not an intermediate expense on components of a final product.
Chart 1 shows schematically where public final demand fits into the national accounts. Public final demand and its bigger brother, private (sector) final demand, make up total domestic final demand. The best-known national accounts aggregate, GDP, is reached after adding to domestic final demand changes in inventories and external trade. The amounts in the boxes of Chart 1 show the magnitudes in 2023/24 — clearly, domestic final demand is the main driver of GDP.
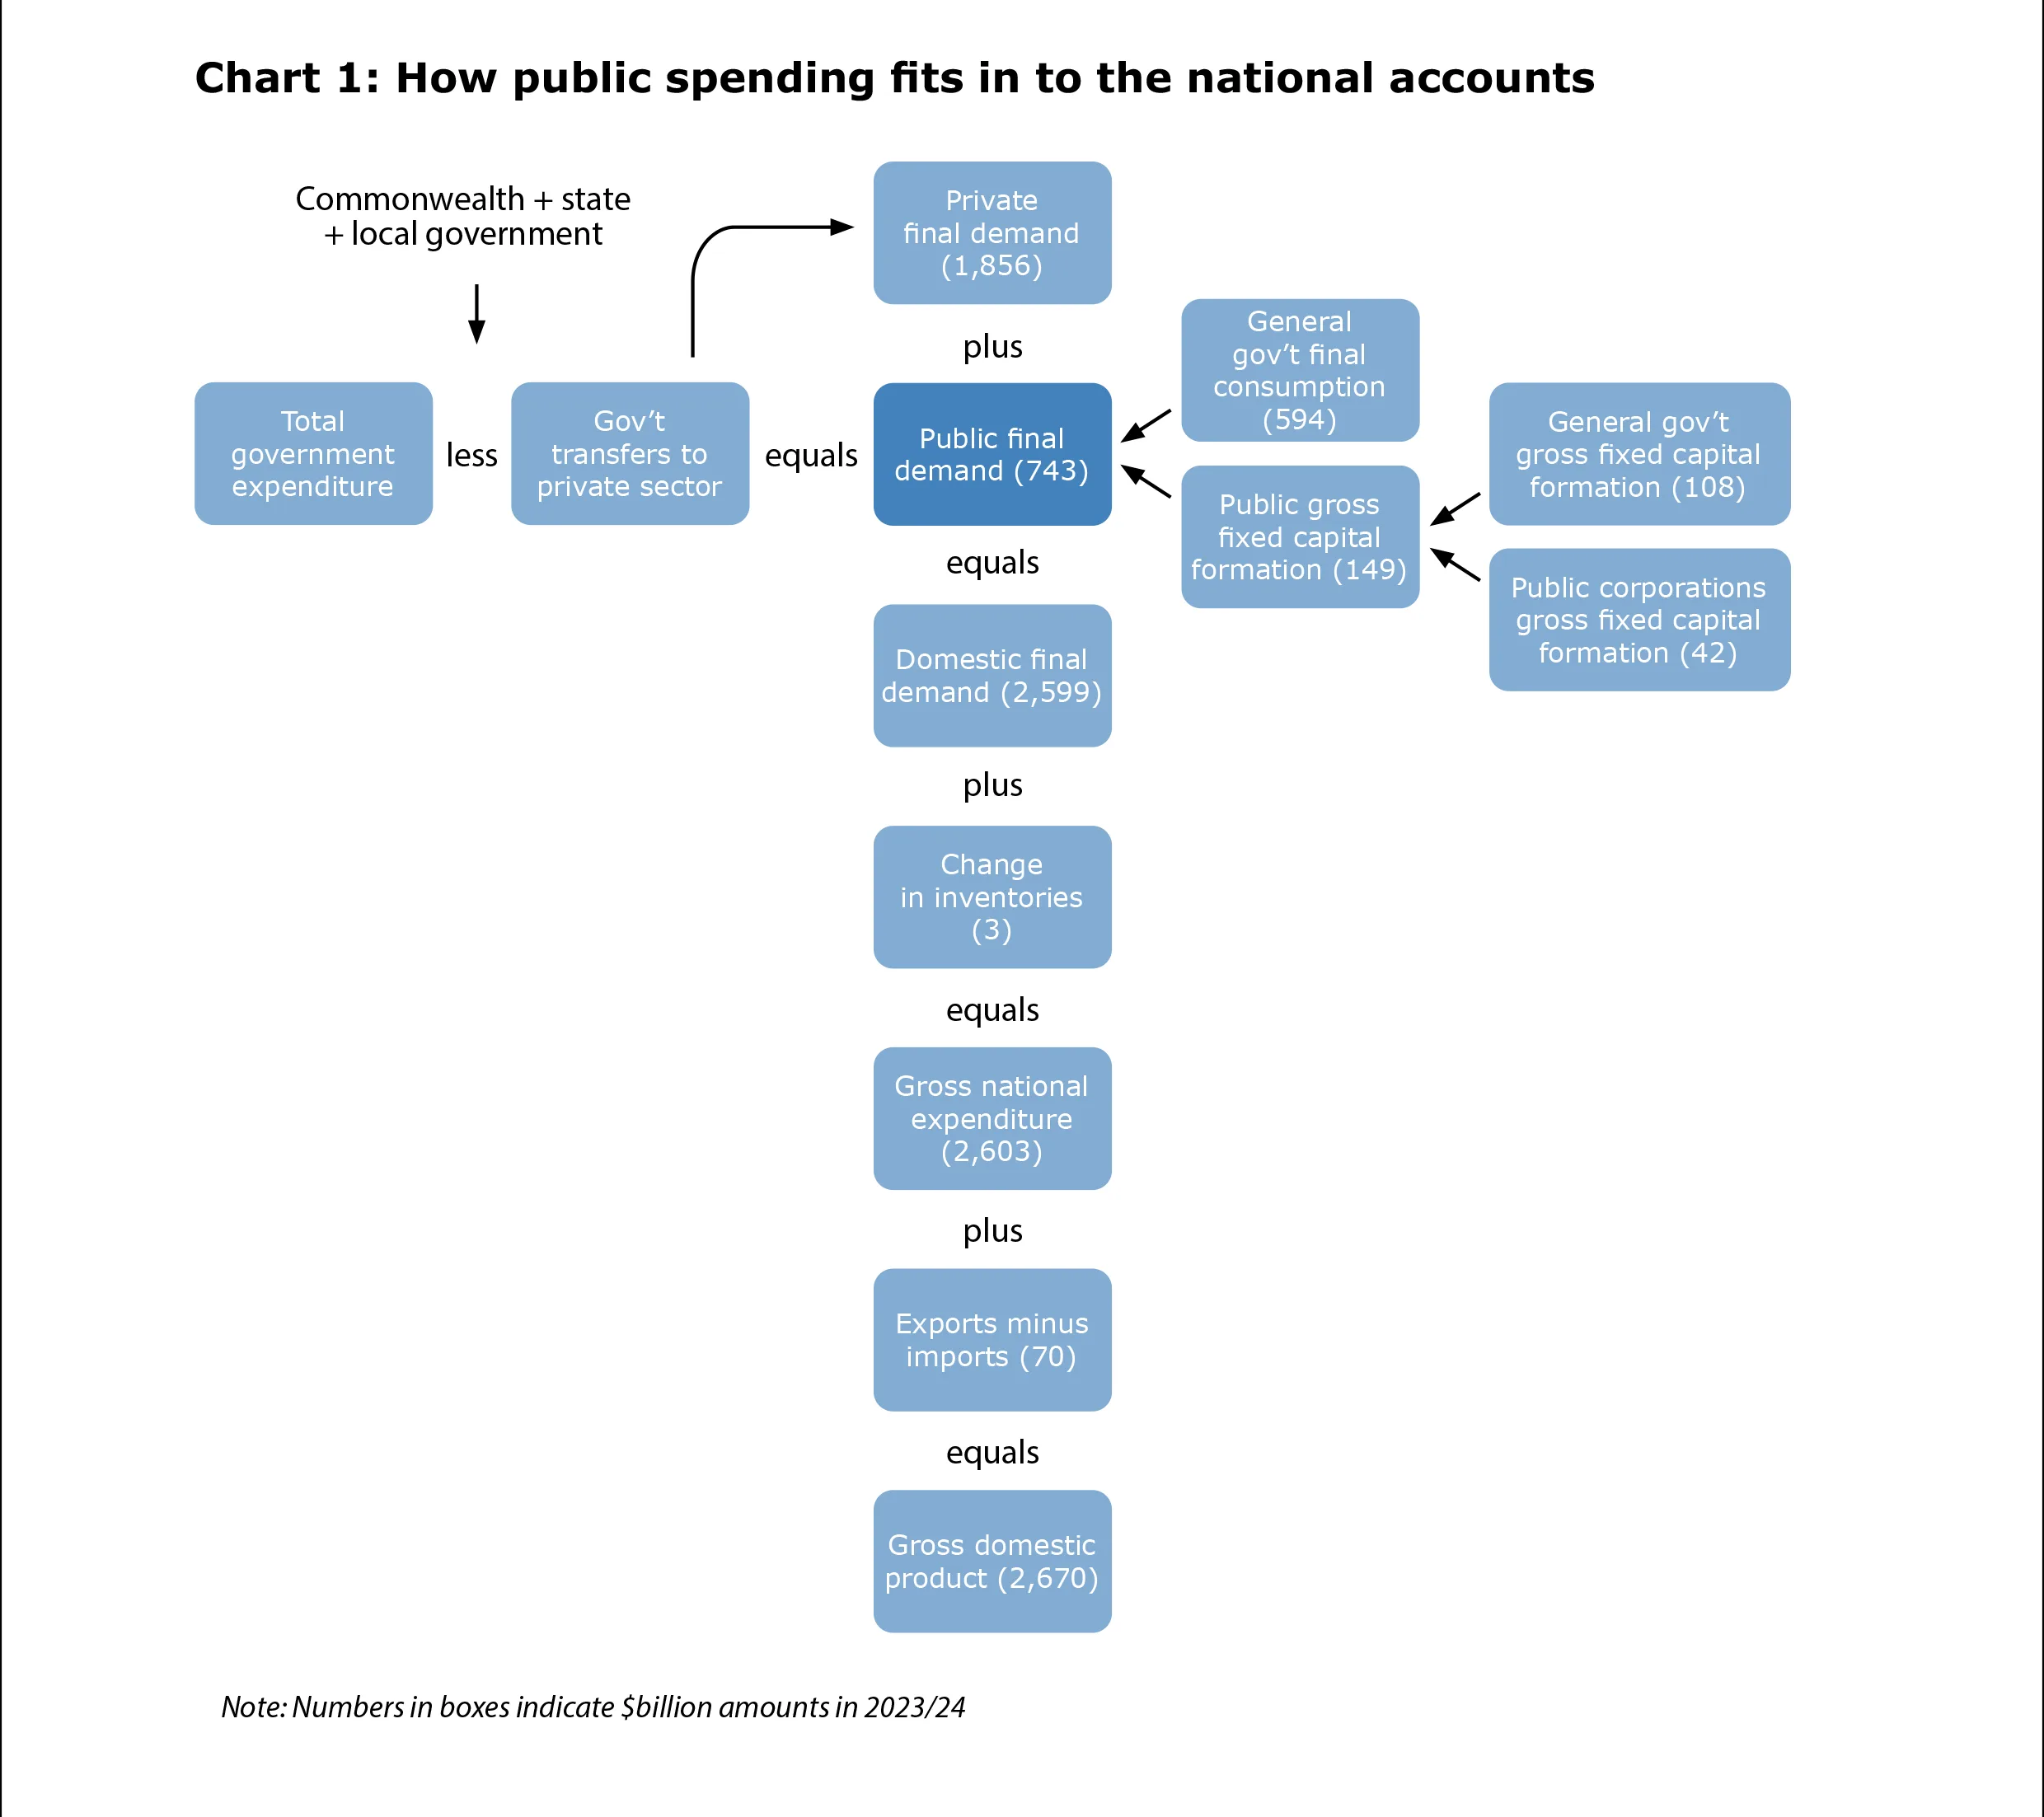
When the RBA speaks of aggregate demand, it is referring to total domestic demand and its private and public components.
Private final demand consists of household final consumption expenditure and private sector gross fixed capital expenditure. Similarly, as Chart 1 shows, public final demand consists of general government final consumption expenditure and public sector gross fixed capital expenditure, which in turn has general government and public corporation sector components.
Government final consumption expenditure covers everything from wages and salaries of employees to office space rent, public servants’ travel, IT services, and many other items. Gross fixed capital expenditure covers items such as building and construction, major IT equipment, and defence equipment.
One important point to make is that public final demand is less than half the size of private final demand. We have a mixed economy in which the private sector still dominates, despite the enlargement of the public sector over many years.
When the Governor said public demand “is not the main game”, she may have been alluding to this dominance of the private sector. However, it is not only relative levels that matter to inflation but also relative growth rates; and as illustrated below, public sector demand has been growing much faster than private sector demand.
Another important point is that public final demand is not the same thing as total government spending, which is much larger. Although we do not yet have data on total government spending in 2023/24, we do know from 2022/23 data that total spending was more than $1 trillion, or around 50 per cent larger than public final demand.[iii]
The difference of more than $300 billion comprises mainly what can be broadly labelled ‘transfer payments’ from the public to the private sectors — for example: social benefit payments to households, various subsidies, and interest on public debt. Payments of this kind do not feed directly into aggregate demand or GDP. The effects on those aggregates depend on what the recipients of the transfers do with the money they receive. In practice, much of it will go into household consumption but some portion of it will be saved by the recipients, and that portion will vary from year to year.
The important point is that public final demand is the most direct channel through which public spending affects aggregate demand, but there is also an important indirect channel from other types of public spending. A complete picture of the effects of public spending on inflation requires us to look at all types of spending, not only public final demand.
Trends in public final demand
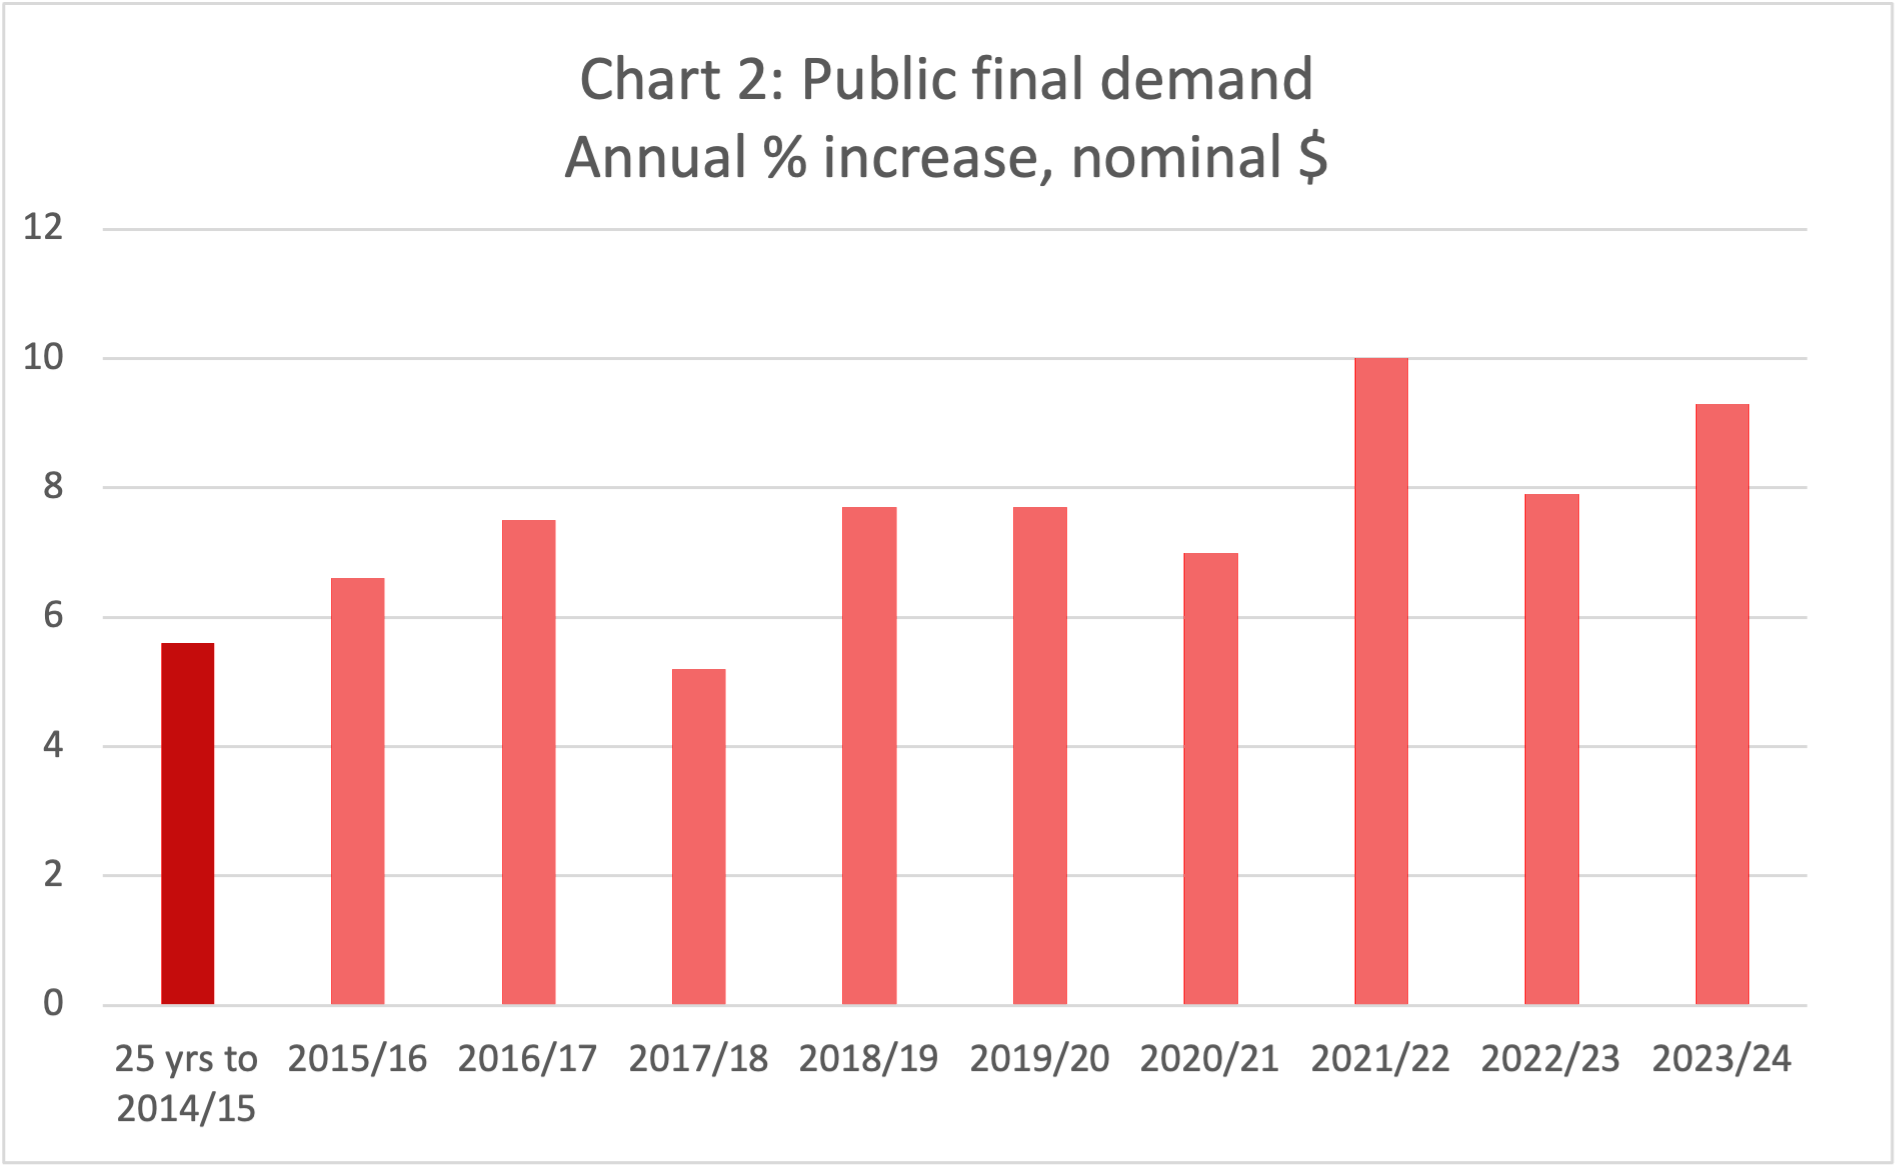
Chart 2 illustrates the historical and recent growth rates of public final demand in nominal terms. The historical growth rate is represented by the 25 years to 2014/15; which included periods of recession, the global financial crisis, episodes of restraint as well as years of profligacy, and many different Labor and Coalition governments at federal and state levels.
The chart reveals that in the 25 years to 2014/15, public final demand grew at an average annual rate of 5.6 per cent, which provides a point of reference for the average growth of 7.6 per cent in the nine years since 2014/15.
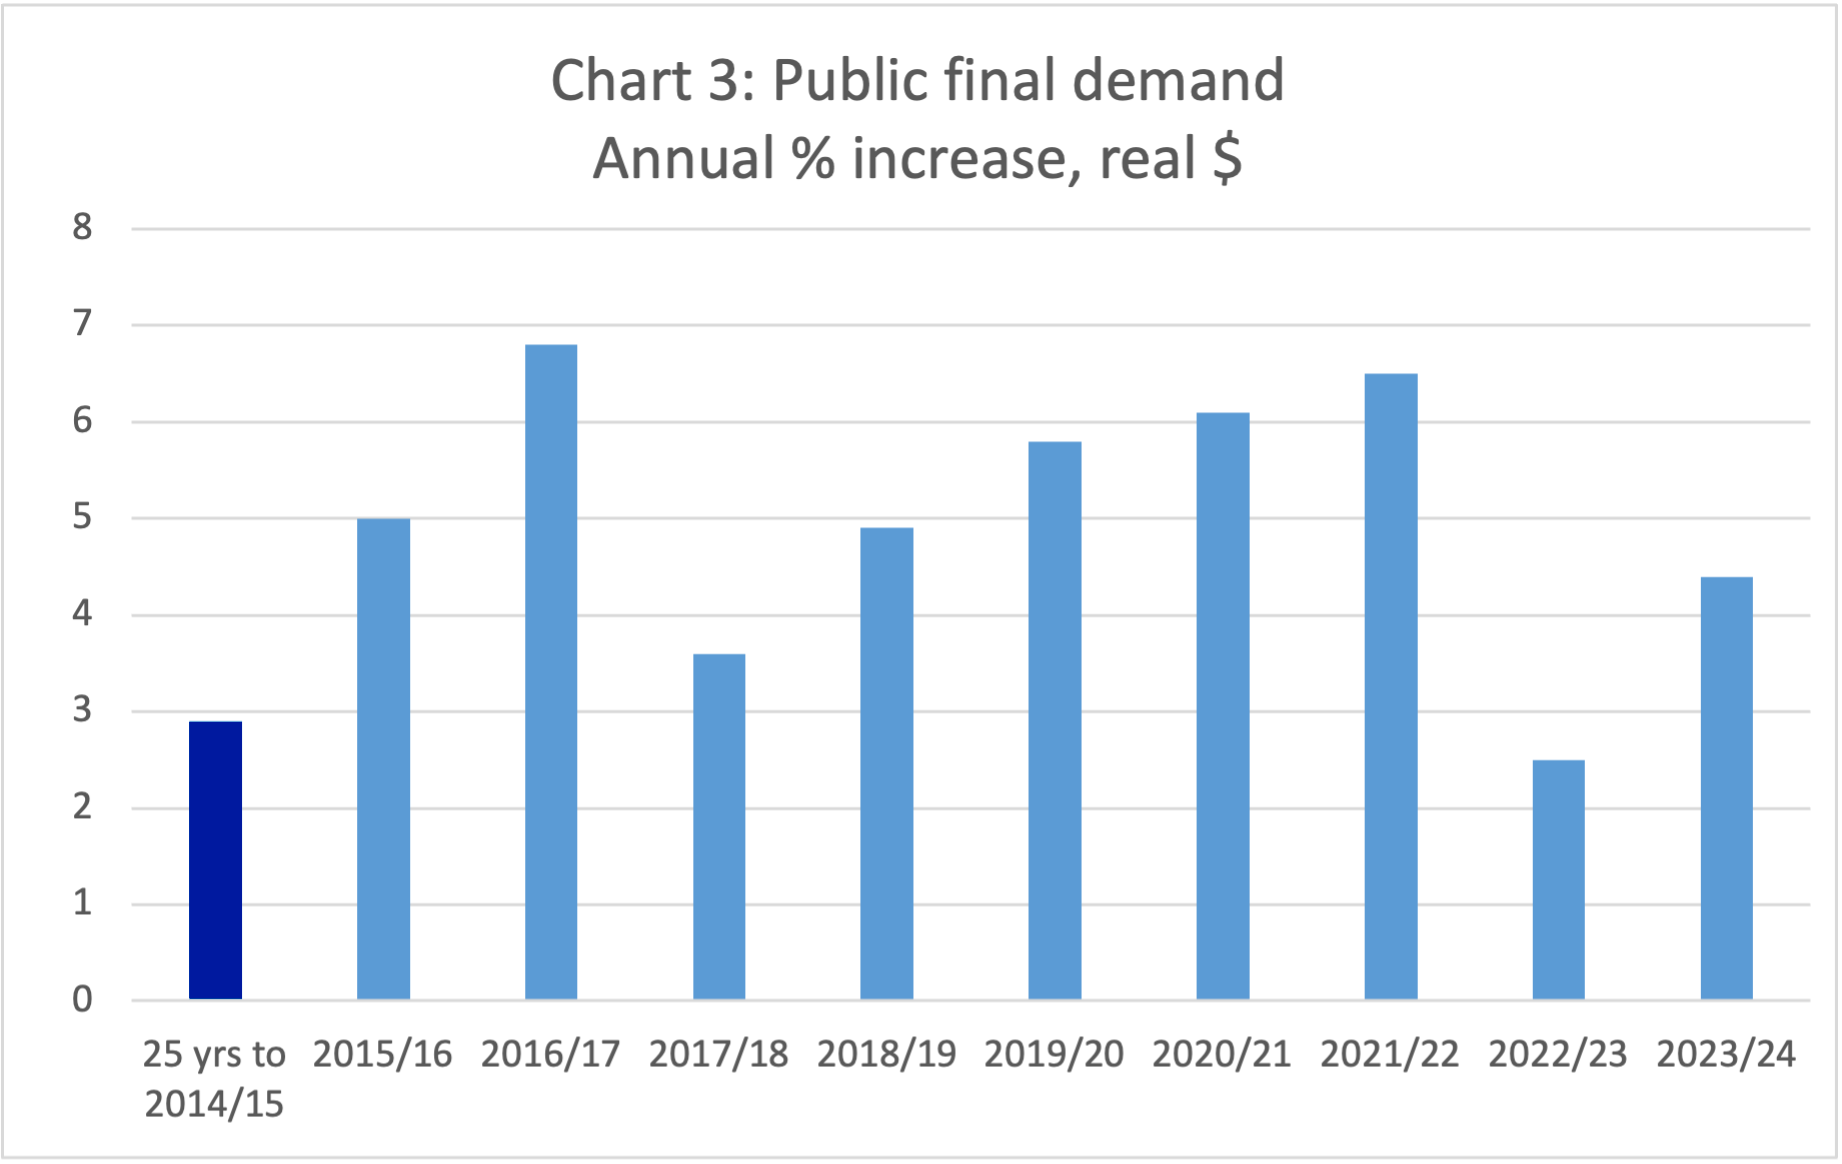
Chart 3 shows the same comparisons for public final demand in real (inflation-adjusted) terms. Growth averaged 2.9 per cent in the 25 years to 2014/15 but has accelerated to 5.1 per cent in the nine years since. By contrast, real GDP growth has slowed from 3.1 per cent to 2.3 per cent.
Not surprisingly, spending growth was particularly rapid in the years affected by the pandemic. However, even before the pandemic, growth was well above the historical average — and since the pandemic there has been no reversal of the very high spending levels of the pandemic years. There was a marked slow-down in growth in 2022/23, but a reacceleration in 2023/24.
Source: ABS, Australian National Accounts: National Income, Expenditure and Product, June quarter 2024.
Source: ABS, Australian National Accounts: National Income, Expenditure and Product, June quarter 2024.
It is not only the year-to-year growth in public demand that matters, but also the effect on the level of spending after a long period of strong growth. The growth in the nine years to 2023/24 — a cumulative increase of 56 per cent — means the level of public demand is high by past standards, and imposing inflationary strain on available resources. Had public final demand grown at its long-run historical growth rate in the nine years to 2023/24, it would have been around $110 billion lower in 2023/24 than it actually was.
There appear to be several reasons for the strong growth in public final demand in recent years. The pandemic was an obvious one, but not the only one. Others include underlying program growth — particularly the NDIS, schools, health, aged care and childcare — a very large increase in infrastructure spending (public gross fixed capital formation), primarily by the states, and relaxation of expenditure constraints around the time of elections.
Another way of putting the growth of government spending into perspective is to compare it with private sector final demand. In the 25 years to 2014/15, private final demand in real terms averaged growth of 3.7 per cent a year, above the figure of 2.9 per cent for public final demand reported above. But since 2014/15, private final demand has risen by only 1.6 per cent a year compared with the public sector at 5.1 per cent.
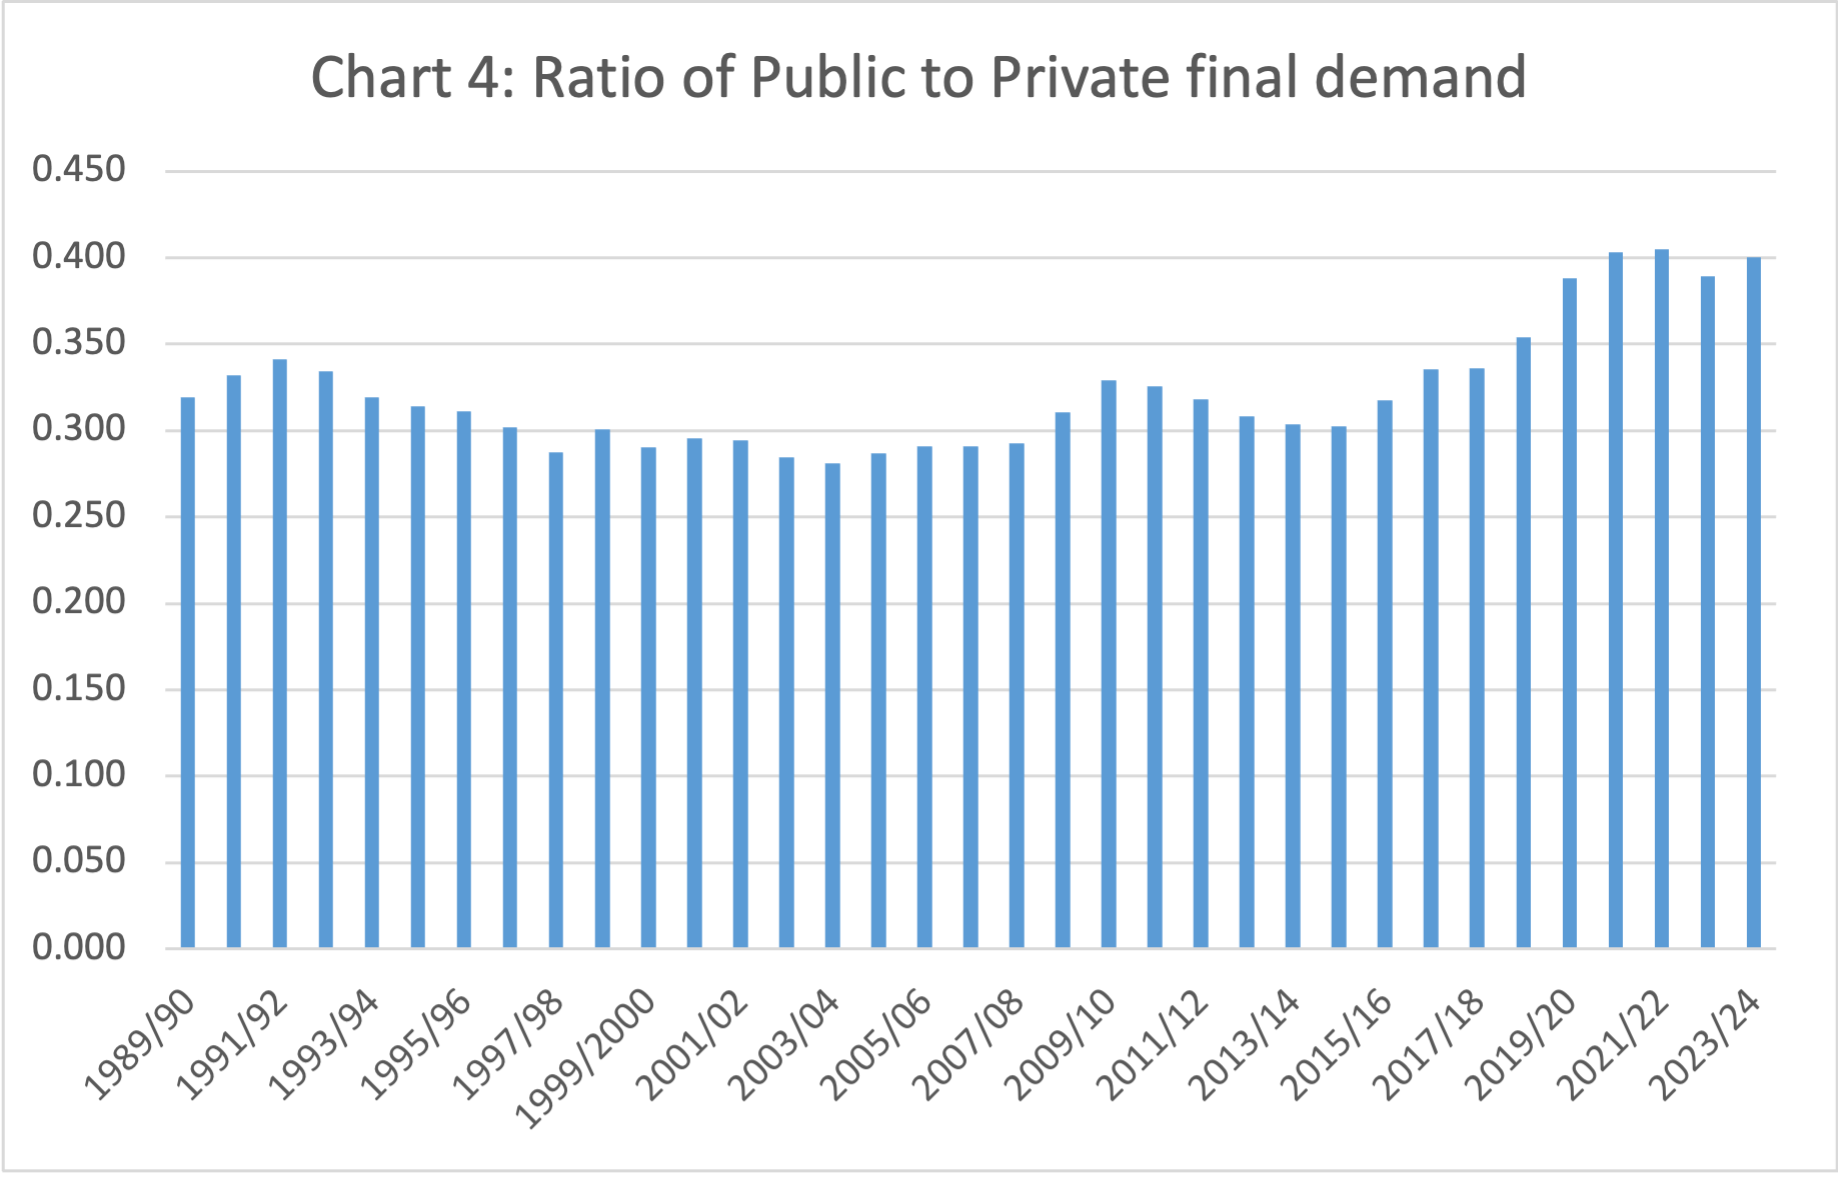
Chart 4 shows the level of nominal public final demand relative to private final demand each year back to 1989/90. Until recent years, public demand fluctuated around 30 per cent of private demand. In other words, for every dollar of private final demand there was about 30 cents of public sector demand. This then spiked to 40 cents during the pandemic and has remained at that historically high level.
Source: ABS, Australian National Accounts: National Income, Expenditure and Product, June quarter 2024.
There are various reasons for the sluggishness of private sector demand; some of them independent of the strength of public sector demand. However, one reason is that strong public sector demand is contributing to the weakness in the private sector — or in other words, the public sector is ‘crowding out’ the private sector. This has happened through interest rate and tax effects; as strong public sector demand has resulted in interest rates being held higher, and the tax burden rising more, than they otherwise would have.
The strong demand for labour generated by public demand — including employment in private entities that are heavily dependent on government payments — may also have stifled private business expansion by restricting the availability of labour.
Composition of public final demand
Public final demand can be dissected into its consumption, investment, federal and state/local government components to shed more light on the sources of growth in demand.
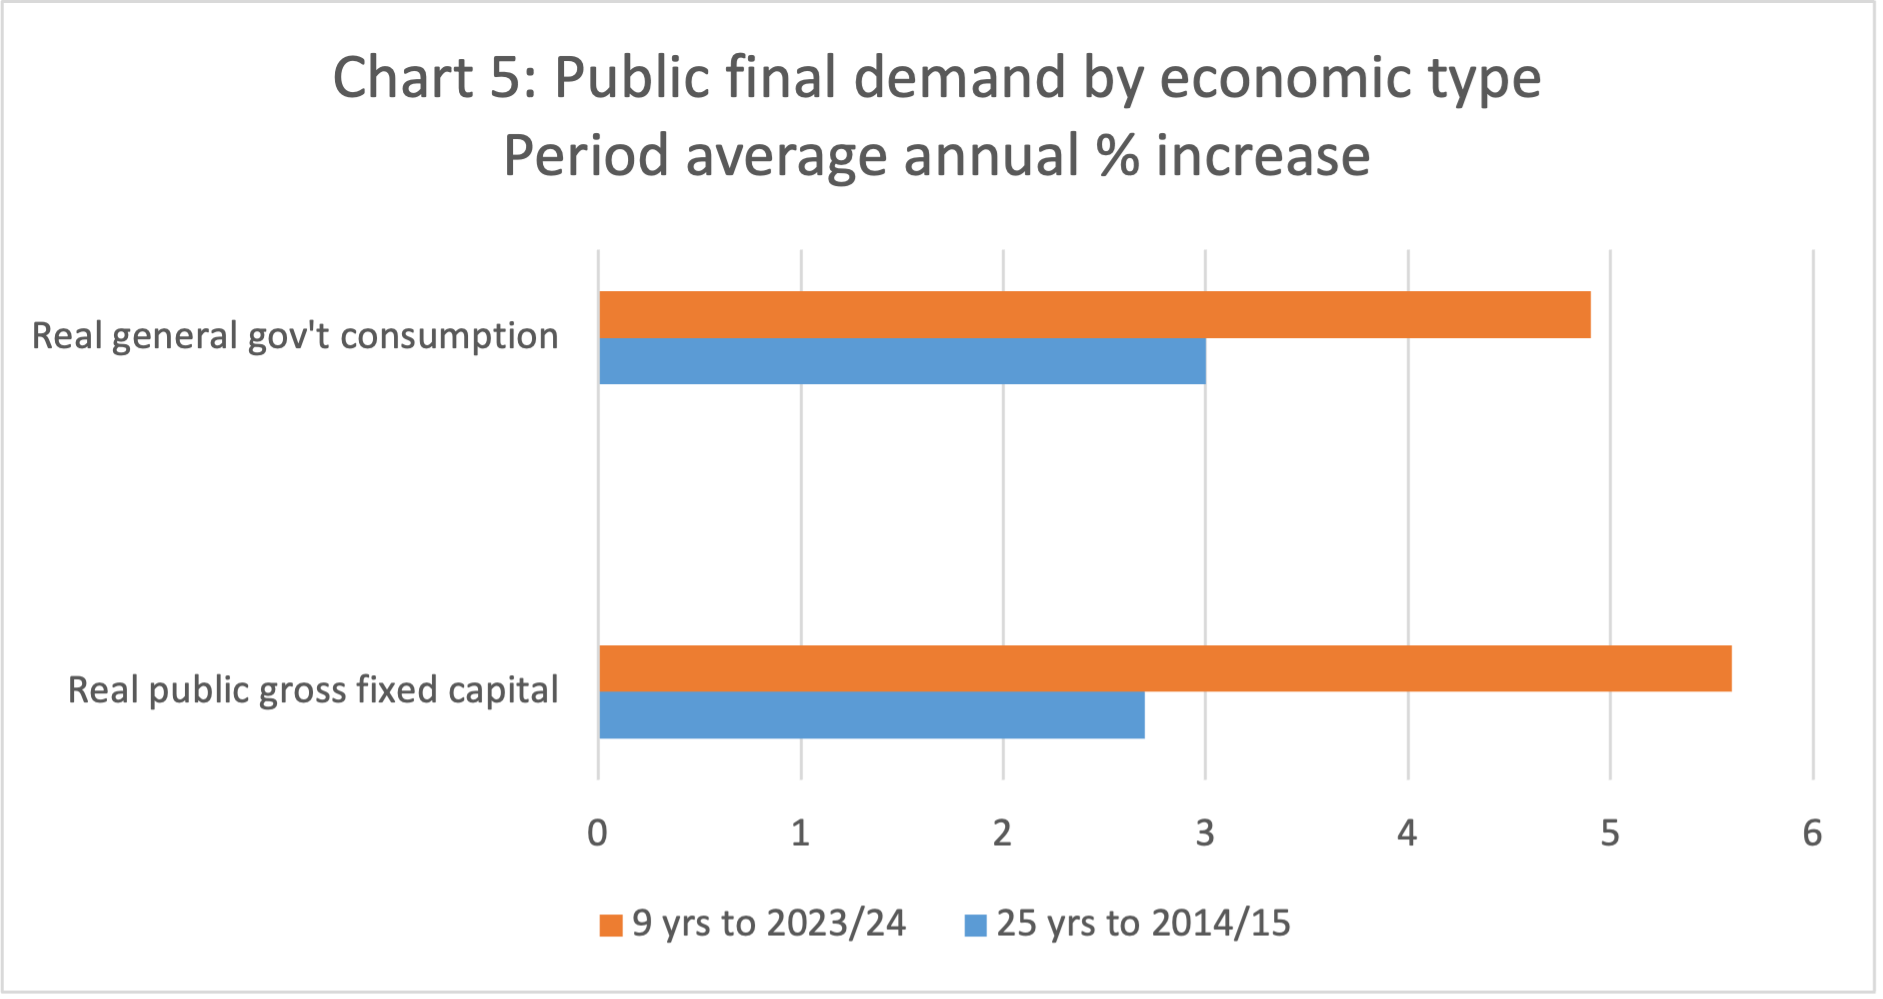
Chart 5 repeats the approach of Chart 3 by showing the real growth of government final consumption expenditure and public gross fixed capital expenditure over 25 years of history and over the past nine years. Over the 25 years to 2014/15, consumption averaged growth of 3.0 per cent a year while capital expenditure averaged 2.7 per cent. These have both accelerated since 2014/15 to averages of 4.9 per cent and 5.6 per cent respectively. The acceleration of capital spending has been particularly strong, reflecting the deep dive into infrastructure development — especially by states and territories. This has contributed to large cost increases and scarcity of labour in building and construction.
Source: ABS, Australian National Accounts: National Income, Expenditure and Product, June quarter 2024.
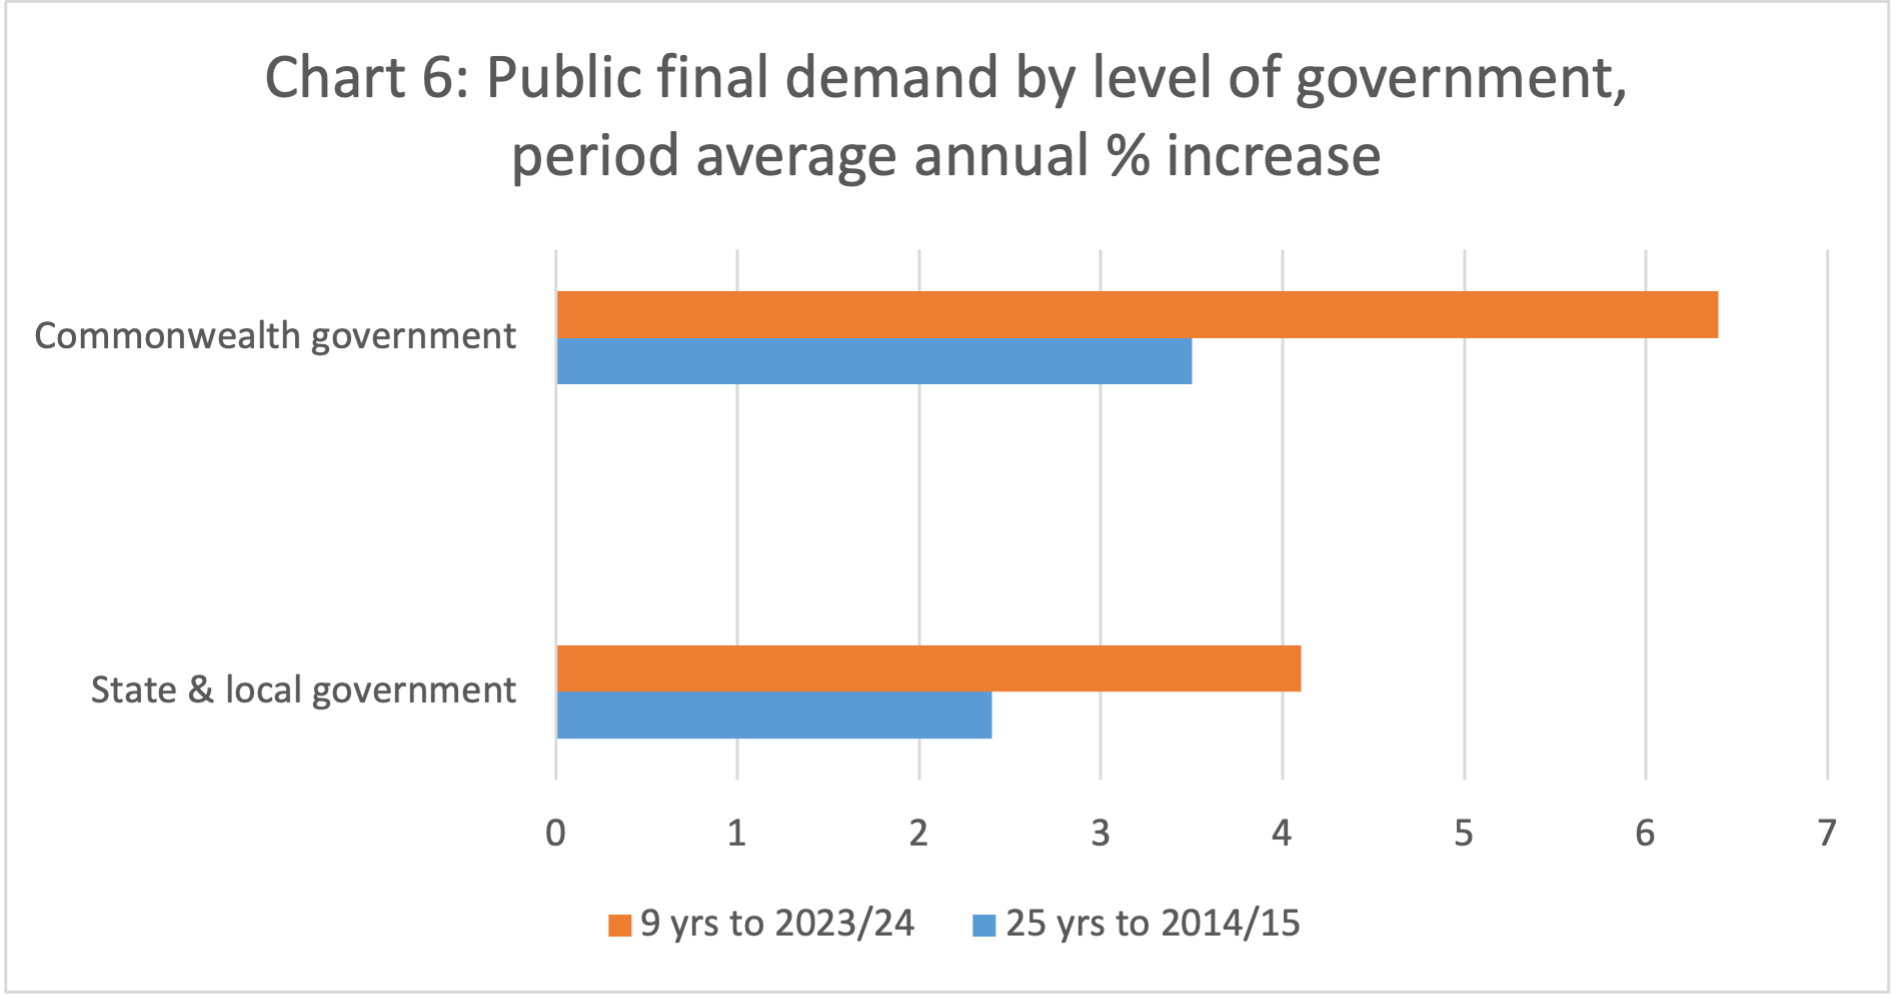
Chart 6 indicates that federal government demand has usually grown more rapidly than state/local government demand, but that both have accelerated sharply from the 25-year average to the past nine years. The very high rate of increase in federal expenditure reflects, among other elements, the extraordinary growth of expenditure on the NDIS.
Source: ABS, Australian National Accounts: National Income, Expenditure and Product, June quarter 2024.
Trends in other government spending
As discussed above, public demand does not encompass all government expenditure, as it excludes transfer payments from the public to the private sector — which are substantial. They comprise mainly social benefit payments to households (such as pensions and unemployment benefits) and various subsidies. Although they impinge less directly on the demand for goods and services, transfer payments are still part of the inflation and ‘crowding out’ impact of government growth.
The pattern of transfer payments has been different from that of public final demand. Looking at transfer payments excluding interest,[iv] historically they have grown faster than public final demand. Over the 25 years to 2014/15, transfer payments grew rapidly at an average of 6.8 per cent a year compared with 5.6 per cent for public final demand. Since 2014/15, the average growth rate for transfer payments has come down to 3.3 per cent whereas public final demand has accelerated to 7.6 per cent.
However, the average for the years since 2014/15 masks a surge in transfer payments during the pandemic and the subsequent decline to a more normal level. As Chart 7 illustrates, transfer payments increased by 70 per cent in just two years — 2019/20 and 2020/21 — reflecting the Jobkeeper scheme and other temporary income support measures introduced in response to the pandemic.
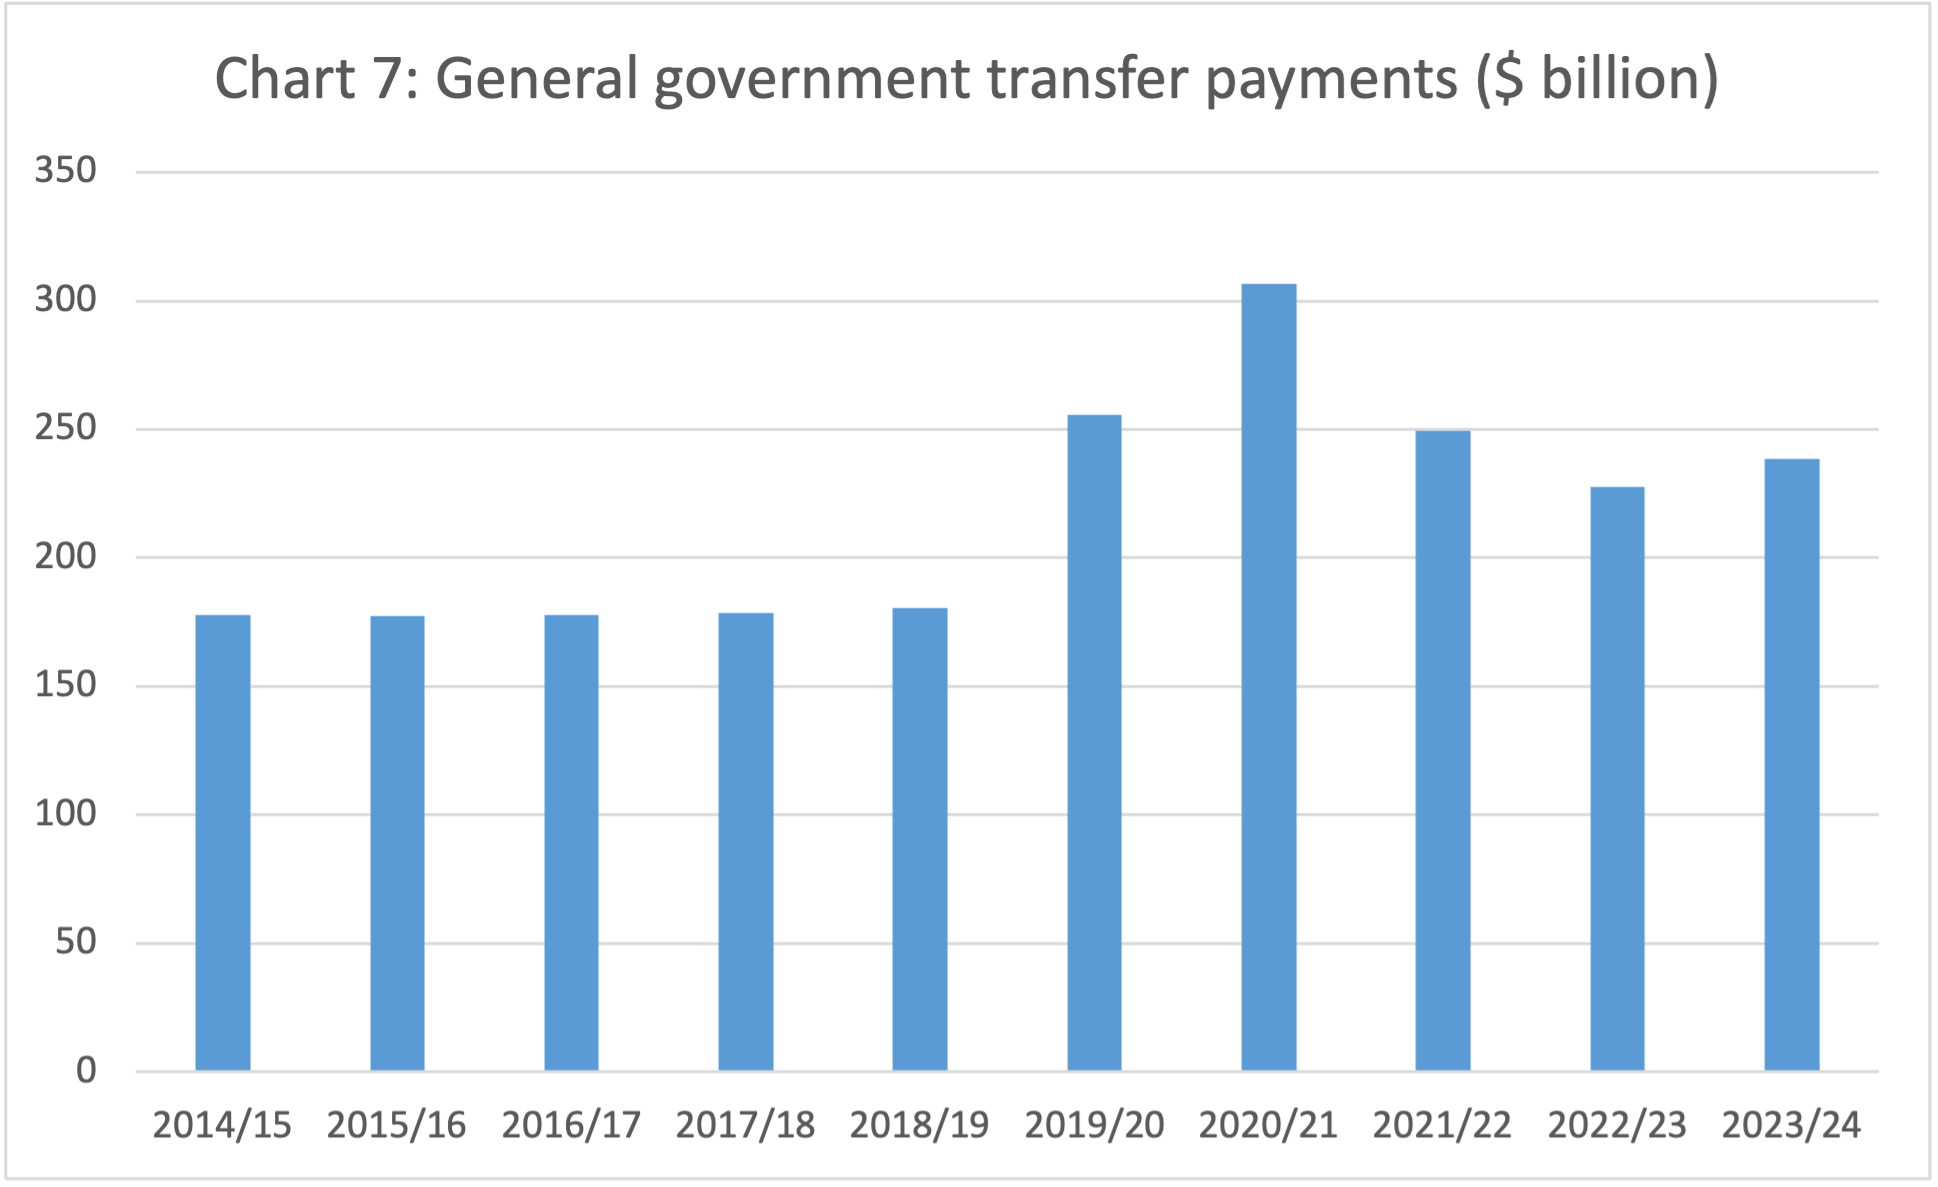
Source: ABS, Australian National Accounts: National Income, Expenditure and Product, June quarter 2024.
By 2023/24, these pandemic effects had dropped out of the system. But in the three years to 2022/23 transfer payments were a remarkable 51 per cent (or $275 billion) higher than in the previous three years to 2018/19. Although this amount replaced lost income, as the well-known economic modeller Chris Murphy has argued, it was a substantial over-replacement of income foregone by the private sector.[v]
The effects of this surge in private sector income on aggregate demand and inflation were initially muted as the household saving ratio increased dramatically in 2020/21, as households faced increased uncertainty and lacked the normal opportunities to spend (particularly on services). However, as conditions changed with the easing and ultimate removal of lockdowns, the saving ratio went into reverse and household consumption surged. Only then, in 2022 and 2023, did the huge increase in government transfer payments have its full effect on aggregate demand and inflation.
Implications of the budget surpluses
The federal government asserts that the federal budget swing into surplus in 2022/23 and 2023/24 is evidence of the anti-inflationary stance of fiscal policy. However, those surpluses occurred despite the strong growth in government spending. They occurred because of a surge in tax revenue that reflected the strong aggregate demand and inflation conditions that the growth in federal spending helped create.
There has been an increase in taxation across the economy as the ratio of tax revenue to GDP and other measures of aggregate private income have increased — a trend that is most apparent in the ratio of personal income tax to gross household income as illustrated in Chart 8. Income tax as a proportion of income increased by around 3.7 percentage points in the 10 years to 2023/24, notwithstanding implementation of stages 1 and 2 of the previous government’s personal income tax cuts during that period. Much of this increase occurred after 2021.

Source: ABS, Australian National Accounts: National Income, Expenditure and Product, June quarter 2024.
An increase of 3.7 percentage points in nine years may not seem much; but it is in fact a very big increase and reflects bracket creep. It has worked as a strong brake on household disposable income and consumption expenditure growth and, as such, a partial offset to the contribution of public final demand to aggregate demand. It is one of the mechanisms by which growth of public sector demand crowds out private sector demand.
The boost to revenue enabled the federal budget to move into surplus for two years. However, stoking aggregate demand and contributing to an overheated economy with increased government spending and then recording a budget surplus with the revenue proceeds of the overheating, is hardly a recipe for a sensible or sustainable fiscal policy.
Increased interest rates have acted as an additional brake on disposable income and consumer spending for the households adversely affected by higher home mortgage rates.
Prospects and policy responses
The RBA expects real public final demand will increase by 4.1 per cent through 2024/25 before easing back to a more normal 2.7 per cent through 2025/26.[vi] Federal and state budgets for 2024/25 point to public sector capital (infrastructure) spending levelling off at a historically high level and then easing back over the following few years.
At the same time, Stage 3 income tax cuts from July 2024 mean the change in income tax will be a positive for household consumption in 2024/25 before bracket creep again drives up average tax rates.
Public sector demand in 2024/25 remains too strong for an economy in which aggregate demand is excessive and inflation is too high, even if it is easing back gradually. However, budgets for 2024/25 are largely set, and it is too late for policy changes to have much short-term impact on the growth of public spending. This is particularly true of infrastructure spending, for which governments make contractual commitments far in advance.
The lesson for policy at this point in the budget cycle is to make sure the expected easing of government spending growth after 2024/25 is actually realised and is not frustrated by yet more new spending plans or blow-outs in the cost of existing programs. All governments need to act accordingly in preparing their 2024/25 budget mid-year reviews (which have tended to become mini-budgets) later in 2024 and in framing their 2025/26 budgets in the first half of 2025. And all political parties need to act on the need for restraint in the promises they make in upcoming federal and state elections.
It should also be said that even if government spending is constrained so its contribution to inflation ceases to be a policy concern, there are other reasons to be concerned about the structural realignment of the economy from the private sector to the public sector — including the resultant pressures for higher taxation, deficits and borrowing.
Conclusion
The RBA has explained that aggregate demand is too high to be met by the economy’s current productive capacity without strain and is therefore leading to stubbornly high inflation above the target of monetary policy.
Public sector demand is clearly contributing to this situation. It has been growing at rates above the long-term average before and since the pandemic, as well as during it. Over nine years to 2023/24, public final demand has increased by a cumulative 56 per cent. After such a long expansion, even if growth of public demand moderates now, its level will remain high.
Massive government transfer payments (mainly income support payments of various kinds) to the private sector during the pandemic — although temporary — over-compensated for lost income. These payments did not directly increase final demand, but they did so indirectly once the pandemic restrictions were removed and consumers spent more freely in 2022 and 2023.
With the exception of those years, private final demand growth has been tepid while public sector demand has been strong. There are signs of a structural realignment of the economy in favour of a larger public sector, which is crowding out the private sector. Even if inflation eases back to the target, this structural realignment will raise concerns about the implications for future taxation, public debt and productivity growth.
[i] Reserve Bank of Australia, Statement on Monetary Policy, August 2024.
[ii] Statement to House of Representatives Standing Committee on Economics, 16 August 2024.
[iii] ABS, Government Finance Statistics, 2022/23.
[iv] This follows the analytical convention of focusing on ‘primary’ government expenditure.
[v] Chris Murphy, ‘Fiscal Policy in the COVID-19 era’, Crawford School of Public Policy, ANU, March 2022.
[vi] RBA, Statement on Monetary Policy, August 2024.