
Introduction
In 2000, renewable energy supplied less than 1% of electricity in the National Electricity Market (NEM) that encompasses Australia’s east coast and southern states. By 2023, renewables had grown to supply 39% of the NEM’s electricity.[1]
Advocates of renewable energy often attribute the growth in renewable energy to technological improvements and increased private sector investments. However, these claims are complicated by the substantial government subsidies supporting the renewables industry. Renewable energy proponents contend that initial government support would enable the renewables industry to achieve the technological improvements and economies of scale needed to become independently profitable. Yet, this profitability remains elusive, especially considering there is no foreseeable end to the subsidies for renewables.
Indeed, the current federal government has further increased subsidies in an effort to achieve its ambitious goal of having renewables supply 82% of national electricity by 2030. The 2024-25 budget allocates more than $22 billion to boost renewables in Australia. This includes $13.7 billion in production tax incentives for green hydrogen and processed critical minerals as well as the $1.7 billion Future Made in Australia Innovation Fund aimed at developing new industries like green metals and low carbon fuels. Additionally, the Capacity Investment Scheme has been expanded to a target of 32 GW of new capacity nationally.[2]
This paper quantifies the value of subsidies from the federal government to the renewables industry over the 10 years to financial year 2022-23. It finds that over that time, Australian taxpayers and electricity customers have paid more than $29 billion in subsidies to producers of renewable electricity through federal government schemes. These subsidies include direct government transfers funded by taxpayers and transfers from private entities to renewable energy providers as mandated by government policies. The latter costs are typically recovered by electricity retailers and passed on to the Australian public in the form of increased electricity surcharges.
The analysis focuses on subsidies under federal government schemes to the renewable energy sector for several key reasons. Firstly, the rising cost of electricity is a pressing concern, making it crucial for taxpayers and consumers to understand the extent of subsidies for renewables that ultimately affect their electricity bills. Secondly, with a federal election on the horizon, this research aims to inform the ongoing debate surrounding energy policy by quantifying the scale and impact of federal subsidies to the renewable sector.
Furthermore, the resurgence of public interest in nuclear power — amid discussions by the Coalition to lift the ban on nuclear energy — warrants a comparison of its costs against the backdrop of the renewables industry; which benefits significantly from government subsidies. Measuring these subsidies provides a vital perspective on the allocation of public resources, prompting a critical examination of whether the substantial financial support for renewables could be more effectively directed elsewhere to improve our energy security and affordability as Australia continues down the path of decarbonisation.
The list of subsidies discussed in this paper is not exhaustive. It does not, for instance, consider the following subsidies which are collectively substantial:
- Energy infrastructure projects directly funded by federal and state governments, such as Snowy Hydro 2.0, which has an escalated total cost of $12 billion;[3]
- The Safeguard Mechanism requiring major carbon-emitting companies to reduce their emissions or purchase carbon credits, with one estimate putting the cost at $906 million per year. This mechanism is more focused on abating emissions rather than directly incentivising renewable energy generation;[4]
- State and territory solar feed-in tariff schemes which have provided households with hundreds of millions of dollars in incentives to install rooftop solar systems;[5] and
- Subsidies to fossil fuel generators to keep them operational in order to manage energy reliability risks resulting from the aggressive replacement of these stable generators with intermittent renewable energy sources, which do not produce sufficient electricity during solar and wind droughts. For instance, the NSW Government would have to pay Origin Energy an estimated $200 to $400 million a year to keep the Eraring Power Station open.[6]
The analysis also does not include the cost of administering the government schemes through various bureaucratic bodies. The research is confined to government subsidies that directly benefit the renewables industry and are amenable to policy changes at the federal level. Therefore, the findings presented here should be taken as a conservative estimate of the total amount of subsidies received by the renewables industry.
The subsidies provided under the Renewable Energy Target (RET) scheme are first assessed, then those in the form of federal government grants and concessional loans through the Clean Energy Finance Corporation (CEFC) and the Australian Renewable Energy Agency (ARENA). The paper concludes with a summary of the findings and their implications.
Renewable Energy Target
The Renewable Energy Target (RET) is a federal government initiative intended to reduce greenhouse gas emissions in the electricity sector and promote electricity generation from renewable sources. It mandates that a specific percentage of Australia’s electricity be sourced from renewables, thereby spurring investment through financial incentives. These incentives are facilitated through the issuance and trading of certificates that represent renewable energy generation. Electricity retailers are legally required to purchase these certificates and surrender them to the Clean Energy Regulator (CER) to fulfil their obligations under the RET.
The RET in its current form consists of two components:
- The Large-scale Renewable Energy Target (LRET) requires electricity retailers to purchase Large-scale Generation Certificates (LGCs) annually from commercial renewable energy projects. Each LGC represents one megawatt hour (MWh) of eligible renewable electricity generation. The LRET’s annual target has steadily grown over time, escalating to the subsidisation of 33,000 gigawatt hours (GWh) of renewable energy annually in 2021.[7]
- The Small-scale Renewable Energy Scheme (SRES) requires electricity retailers to purchase Small-scale Technology Certificates (STCs) from households and small businesses that have installed renewable energy systems like rooftop solar panels or small-scale wind systems.[8] In 2023, electricity retailers were required to surrender approximately 28.5 million STCs, representing 28,500 GWh of electricity, to meet their SRES obligations.[9]
Together, the LRET and SRES incentivise the supply of electricity from both large renewable energy projects and smaller scale systems. The financial support granted to owners of these projects and systems is ultimately funded by electricity consumers through an additional charge on their electricity bills.
The exact annual subsidy costs of the LRET and SRES are not published by the CER. Therefore, this analysis estimates the value of subsidies based on average spot prices for LGCs and STCs each year, including weighted-average spot prices for STCs based on transaction volume data reported by the CER for some years. Although it is possible that some retailers locked in lower LGC prices through earlier power purchasing agreements with wind and solar farms and then passed these savings on to customers — thereby lowering the subsidy burden in some years —more precise estimates cannot be derived in the absence of detailed data. The value of subsidies has been calculated by multiplying the annual target of certificates retailers are required to surrender by the average price for the year. Table 1 shows the annual target and average spot price for LGCs and STCs.[10]
Table 1. Annual targets and average spot prices for LGCs and STCs (2014-2023).
| Year | LGC annual target | LGC average spot price | STC annual target | STC average spot price |
| 2014 | 19,088,000 | $29.43 | 35,700,000 | $38.32 |
| 2015 | 16,950,000 | $35.59 | 18,657,338 | $38.76 |
| 2016 | 18,850,000 | $71.43 | 20,567,438 | $39.84 |
| 2017 | 21,431,000 | $84.24 | 16,957,024 | $39.82 |
| 2018 | 26,031,000 | $82.92 | 12,450,191 | $36.77 |
| 2019 | 28,637,000 | $53.85 | 29,297,525 | $36.32 |
| 2020 | 31,244,000 | $39.86 | 37,466,219 | $38.03 |
| 2021 | 33,850,000 | $39.01 | 42,620,436 | $38.47 |
| 2022 | 33,000,000 | $42.45 | 50,665,467 | $39.23 |
| 2023 | 33,000,000 | $56.50 | 47,699,563 | $39.90 |
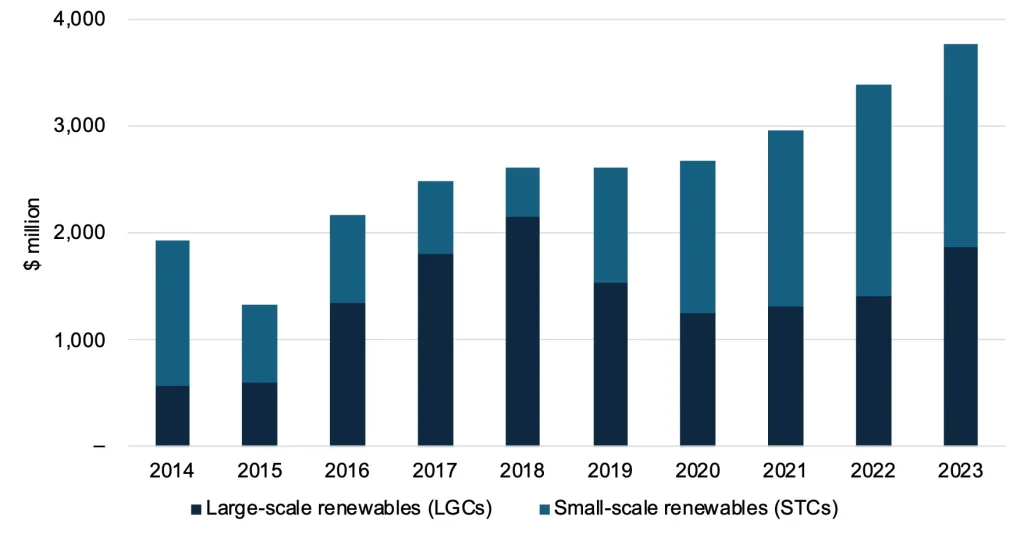
Under RET mandates, it is estimated that Australian electricity customers have contributed a total of $14 billion since 2013-14 to subsidise large-scale power station developers, and an additional $11.5 billion to households and businesses with rooftop solar installations and other small-scale systems (Figure 1). This amounts to an average of $2.6 billion in subsidies per year, making it the largest source of subsidy to the renewable energy sector. Based on the prices of LGCs in the forward market, it is projected that electricity customers will pay another $7.2 billion to large-scale renewable energy providers from 2024 to 2030 when the scheme is scheduled to end.[11]
Figure 1. Estimated annual subsidies to large-scale and small-scale renewable energy projects under RET mandates (2014-2023).
Non-RET demand for Large Generation Certificates
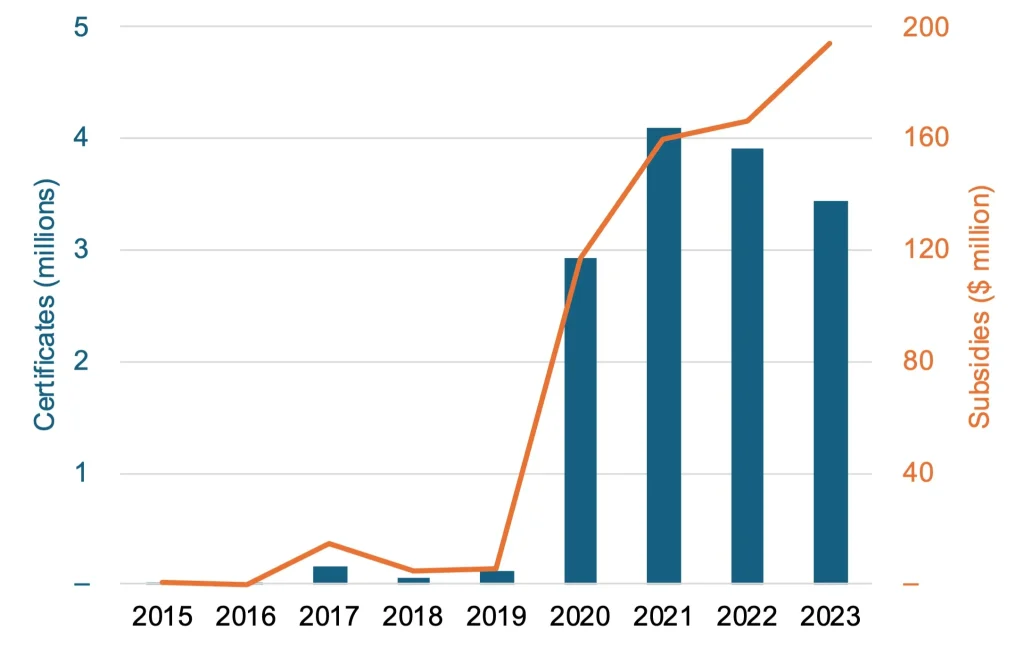
In addition to the federal government’s RET mandates, various private entities have also acquired and surrendered large amounts of LGCs in order to comply with regulatory requirements imposed by municipal, local, state, and territory governments. These government bodies have also directly purchased LGCs using taxpayer money to meet their own emissions reduction targets. These activities have resulted in an additional purchase of 14.7 million LGCs since 2015, equating to approximately 14,700 GWh of subsidised renewable energy. This represents another estimated $663 million in subsidies from Australian taxpayers and electricity consumers injected into the large-scale renewable energy sector over the past decade (Figure 2).
Figure 2. Additional subsidies from non-RET LGC purchases by government entities and government mandates (2015-2023).
Federal grants and concessional loans
Besides the RET scheme, which mandates third-party transfers to the renewables sector, the federal government also provides direct transfers to subsidise the entire innovation chain of renewable energy. This support spans from initial research and early-stage development to the full-scale commercialisation of new technologies. These direct transfers are primarily channelled through two key entities: the Australian Renewable Energy Agency (ARENA), which provides grants; and the Clean Energy Finance Corporation (CEFC), which offers concessional loans and equity investments. These efforts are intended to stimulate innovation and accelerate the adoption of renewable energy technologies across Australia.
Australian Renewable Energy Agency (ARENA)
ARENA was established by the Rudd-Gillard government in 2012 with the objective of increasing the supply of renewable energy, primarily by providing grants to spur innovation in renewable energy technologies and projects. The agency’s existence was briefly threatened by the Abbott government, which attempted to abolish ARENA and other renewable energy subsidies, but these efforts were ultimately unsuccessful.
Since its inception, ARENA has committed $2.25 billion in total grant funding to 663 projects, ranging from research and development to early-stage commercial deployment.[12] Figure 3 shows the annual amount of cash grants ARENA has paid to new renewable energy projects over the last ten years up to 2022-23, amounting to a total of $1.8 billion.[13]
Figure 3. Annual cash grants paid by ARENA to renewable energy projects (2014-2023).
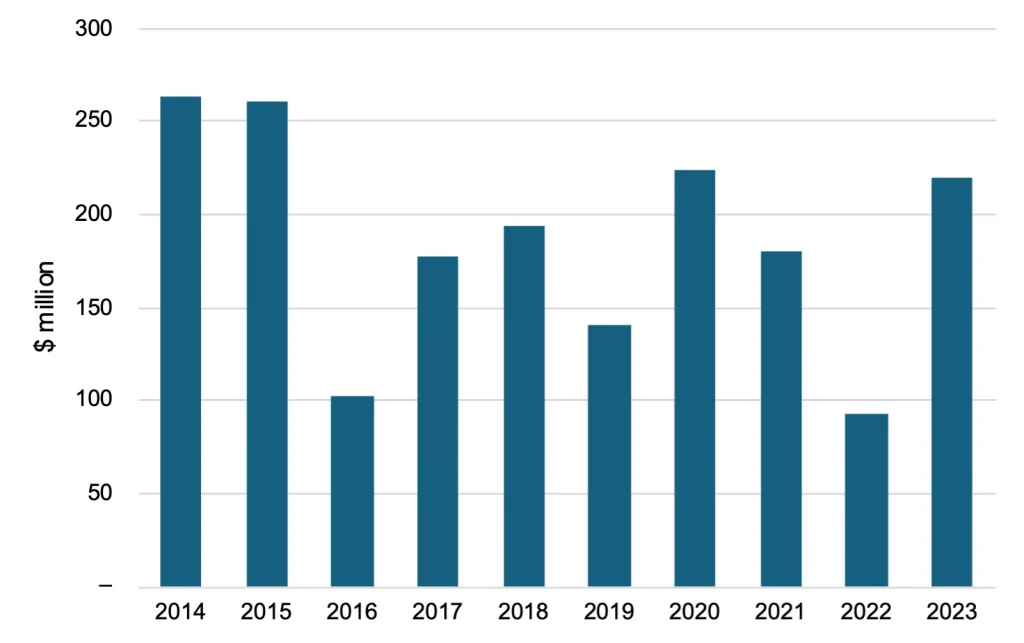
ARENA seeks to incentivise private sector investment in renewable energy in accordance with the federal government’s Low Emissions Technology Statement (LETS).[14] In the year 2022-23, ARENA reported that its commitment of $358 million to new projects leveraged an additional $1.2 billion from third-party sources, resulting in an overall investment leverage ratio of 3.44.[15] This means that for every dollar of ARENA grants to new projects, private sector and other government entities contributed an additional $3.44.
This paper’s analysis conservatively excludes third-party investment from the headline sum of subsidies to renewables. However, these third-party co-investments, driven by government initiatives, represent a diversion of funds from other potential investments within Australia’s economy. Despite ARENA’s commercial focus and its aim to provide only the “minimum financial assistance”[16] necessary for public renewables investment, it is inevitable that such state-driven investments will distort market capital allocation. This distortion prevents capital from being directed to its most efficient use within Australia’s economy.
It is noteworthy that in the recent 2024-25 budget, the government announced an additional funding package of $7.1 billion for ARENA to administer various renewables funding initiatives. This package includes $2 billion for the second round of the Hydrogen Headstart program, $1.7 billion for the Future Made in Australia Innovation Fund, and $1.5 billion for the Solar Sunshot and Battery Breakthrough programs.[17] This makes ARENA the federal agency receiving the largest slice of the $22 billion earmarked for renewable energy in the budget.
It is also worth noting that the funding for the Solar Sunshot program is about one-eighth of the $7.8 billion in subsidies necessary to support a full value chain for solar panel manufacturing over the next 10 years, as estimated by a 2024 Silicon to Solar study commissioned by ARENA.[18] The study acknowledges that even with that level of subsidy, Australian solar manufacturers will still face a “significant economic disparity at every stage of the value chain in comparison to Chinese manufacturers.”[19] It goes on to advocate for a mix of local procurement rules for Australian governments and local content incentives to stimulate domestic demand for the more expensive Australian-made solar panels instead of cheaper imports. Essentially, the study admits that establishing a fully-fledged solar PV manufacturing industry would require an additional $6.3 billion in subsidies on top of the Solar Sunshot program, plus procurement restrictions and other government incentives, to produce Australian solar panels that would still be uncompetitive.
Clean Energy Finance Corporation (CEFC)
Established in 2012, CEFC serves as Australia’s ‘green bank’ with the aim to “facilitate increased flows of finance into the clean energy sector and the achievement of Australia’s greenhouse gas emissions reduction targets.”[20] CEFC does not provide direct grants. Instead, it offers debt or equity funding to renewable energy projects that show potential for financial returns. However, CEFC operates differently from traditional commercial lenders in providing concessional finance as part of its investment mandate to promote the transition to clean energy and decarbonisation.
Concessional finance is a growing form of government intervention across various sectors in Australia, including the renewables industry.[21] The CEFC’s concessional finance functions as a subsidy to the renewables industry by reducing the cost of capital for renewable energy firms, a benefit not extended non-renewable energy providers. Due to its government ownership, the CEFC faces limited pressure to achieve a commercial rate of return. In fact, the CEFC has consistently underperformed its return benchmark since its inception, as discussed below. This contrasts with private financial institutions, where market forces ensure that financing aligns with risk-adjusted market rates of return.
To support the energy transition, the CEFC offers various concessions in its renewable energy investments, including:
- lower-than-market interest rates;
- extended loan maturities; and
- more flexible grace periods for principal and interest payments.
These favourable funding arrangements represent a considerable degree of subsidy and are often critical in overcoming financial hurdles for clean energy projects that might not otherwise be commercially financed by the market.
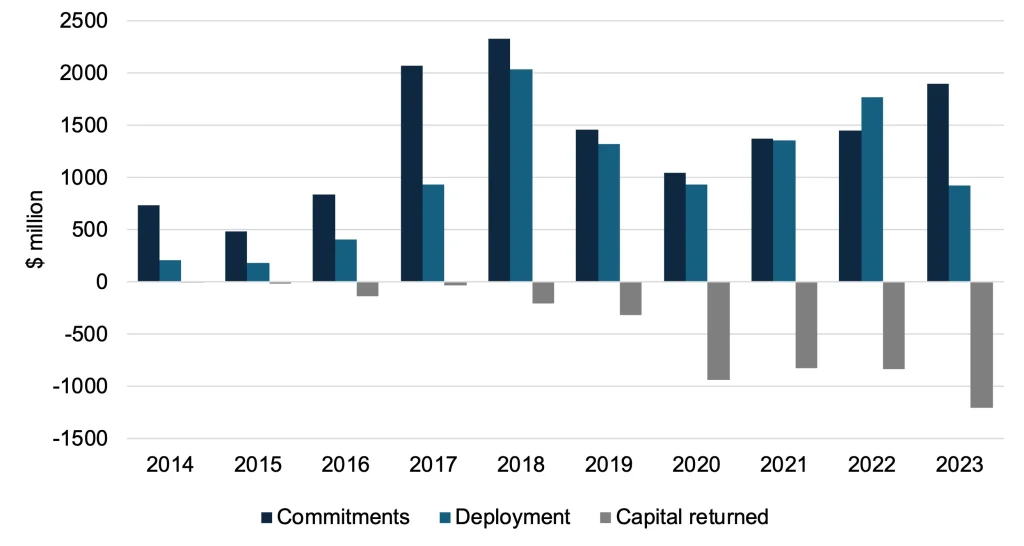
Over the decade leading up to 2022-23, the CEFC committed $13.7 billion in funding for renewable projects (Figure 4).[22] The CEFC’s investments have predominantly been in debt financing, although the level of equity investments has doubled from approximately 17% in 2016-17 to 34% in 2022-23. CEFC investments are managed through the CEFC General Portfolio and five specific investment funds: the Rewiring the Nation Fund, Household Energy Upgrades Fund, Powering Australia Technology Fund, Clean Energy Innovation Fund, and Advancing Hydrogen Fund.
Figure 4. CEFC investment profile over the 10 years to 2023.
This paper takes a conservative approach in estimating the implicit subsidies in CEFC’s debt and equity investments; disregarding the benefits from extended loan maturities and more flexible grace periods, and focusing solely on the lower-than-market expected returns. Specifically, the subsidies incorporated in CEFC’s concessional loans and equity investments are valued by calculating the difference between the prevailing market interest rates and typical equity return benchmarks (such as those for private equity and venture capital funds) and the lower interest rates and expected returns on equity offered by CEFC. This differential represents the financial advantage provided to renewable energy projects through CEFC’s favourable funding conditions.
Subsidised loans
The subsidies in CEFC’s concessional loans are calculated by drawing on CEFC’s financial statements. The interest rates charged for individual debt financing by CEFC are not disclosed due to commercial sensitivity, although an audit report by the Auditor-General for Australia in 2020 revealed that discounts on loans approved in 2018-19 ranged from 0.2% to 1.5%, with market rates assessed between 2.6% and 9%.[23] Nevertheless, the aggregated value of concessionality across all CEFC loans is reported in the income statement as “concessional loan charges”, which represent the financial cost of providing loans at below-market interest rates. From 2013-14 to 2022-23, the value of the concessions made on CEFC loans amounted to $89 million.[24]
The concessionality charge for discounted loans in each financial year has been well below the limit of $300 million set out in section 9 of the CEFC’s Investment Mandate. However — and perplexingly — it is worth noting that in the 2024-25 Department of Climate Change, Energy, the Environment and Water (DCCEEW) budget estimates, expected annual concessional loan charges reported by the CEFC jump to $4.5 billion in 2024-25, $1.1 billion in each of the subsequent two years, and fall back to $89 million in 2027-28.[25]
Subsidised equity investments
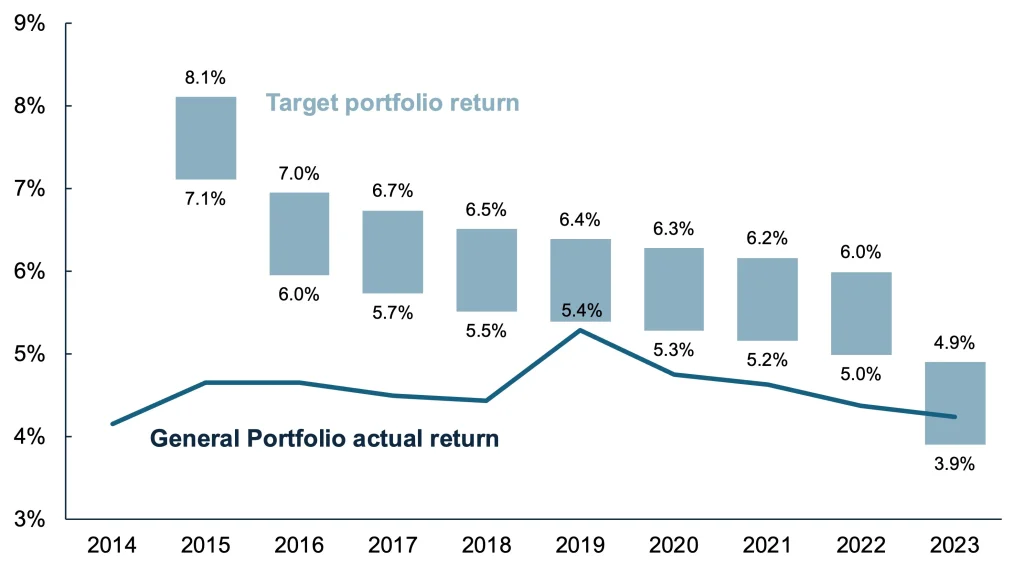
Estimating the value of subsidies in CEFC’s equity investments is challenging due to the lack of detailed equity returns data at the project or portfolio level. Given this lack of transparency, the implicit subsidies involved in equity investments are estimated by comparing the CEFC General Portfolio return to the historical average return of private equity and venture capital funds. Private equity and venture capital funds typically target higher returns due to the associated risks, often ranging from 15% to 25% per year. In contrast, CEFC’s Investment Mandate requires the board of CEFC to target an average return of at least the 5-year federal government bond rate plus a specified spread per year over the medium to long term. Figure 5 shows CEFC’s reported annualised rates of return, before operating expenses, since inception for its General Portfolio compared to the portfolio benchmark return. Prior to 2023, CEFC had not met its target benchmark returns, a shortcoming noted by the Auditor-General.[26]
Figure 5. CEFC General Portfolio actual returns vs. target portfolio returns (2014-2023).
According to data compiled by Cambridge Associates for the Australian Investment Council, Australian private equity and venture capital funds delivered annualised returns of 18% over the 10-year period and 14% over the 20-year period ending 30 June 2023.[27] The 14% figure is conservatively used as the annual market return for comparison with the CEFC General Portfolio’s rate of return at the end of each year. The difference between the General Portfolio rate of return and the 14% market return is multiplied by the equity investment amount on CEFC’s balance sheet to estimate the annual value of subsidies in their equity investments.
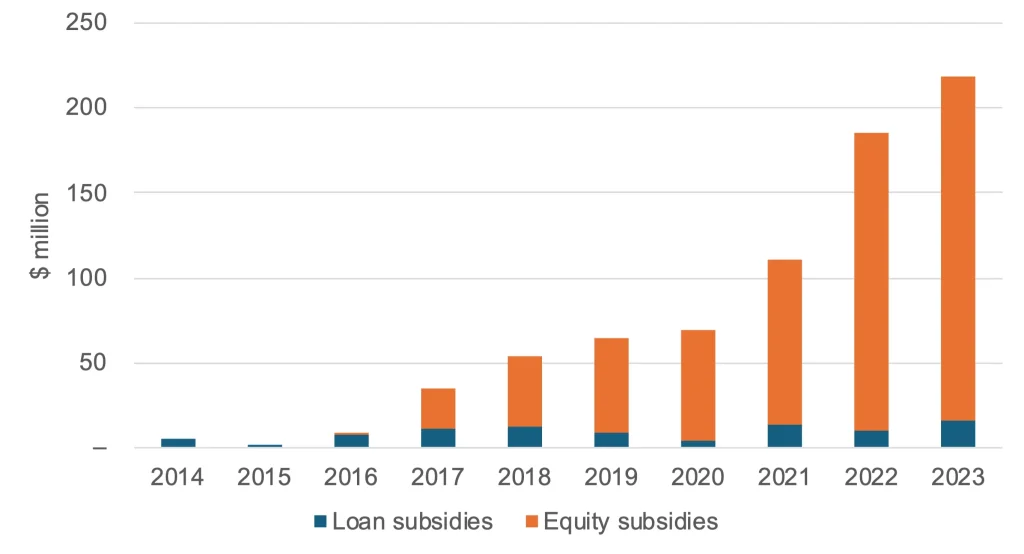
CEFC made its first equity investment in 2016, and its equity investment on the balance sheet has grown from $247 million in 2017 to $2 billion in 2023. The average spread between the General Portfolio return and the private equity/venture capital fund return of 14% has been 9.4% over this period. Accordingly, the annual value of equity subsidies is estimated to have grown from $24 million in 2017 to $203 million in 2023. Figure 6 shows the total estimated value of subsidies from CEFC’s debt and equity financing.
Figure 6. Total estimated value of subsidies from CEFC’s debt and equity financing (2014-2023).
Similar to ARENA, the CEFC aims to catalyse and leverage private sector capital investment in renewables, targeting a financial leverage of $2.50 to $3 for every dollar of its investment. In 2022-23, the CEFC reported a historic high financial leverage of $5.02 to $1, leveraging $11.7 billion in additional private investment across Australia.[28]
The impact and future of renewables subsidies
Taking stock of the analysis, the total estimated value of subsidies provided to the renewable energy sector by the federal government schemes amounts to approximately $29 billion over the past 10 years (Table 2). This headline sum includes the significant financial support channelled through various mechanisms, including the Renewable Energy Target (RET) scheme, grants from the Australian Renewable Energy Agency (ARENA), and concessional loans and equity investments from the Clean Energy Finance Corporation (CEFC). These subsidies have played a crucial role in driving the growth of renewable energy in Australia, which now supplies 39% of electricity in the National Electricity Market (NEM) as of 2023, up from less than 1% in 2000.
Table 2. Estimated subsidies for renewable energy through federal government schemes (2014-2023).
| Federal schemes | Estimated subsidy value | |
| Renewable Energy Target | ||
| Large-scale Renewable Energy Target | $13,849 million | |
| Small-scale Renewable Energy Target | $12,063 million | |
| Non-RET mandated purchases of large-scale generation certificates | $663 million | |
| Subtotal | $26,575 million | |
| Federal grants and concessional loans | ||
| Australian Renewable Energy Agency grants | $1,852 million | |
| Clean Energy Finance Corporation – subsidised loan financing | $89 million | |
| Clean Energy Finance Corporation – subsidised equity financing | $663 million | |
| Subtotal | $2,604 million | |
| Total federal subsidies for renewables | $29,178 million | |
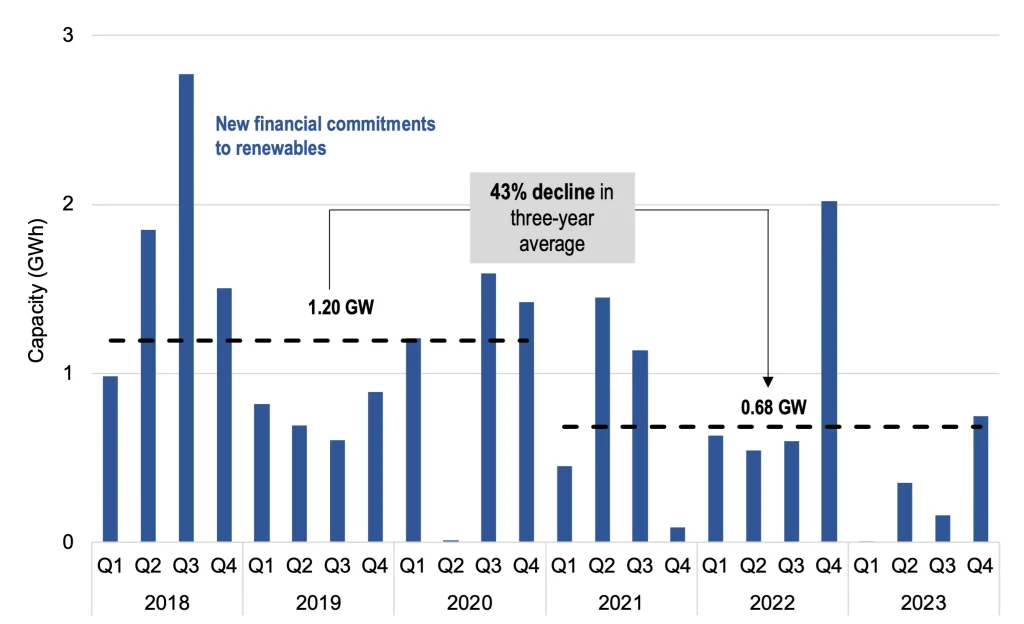
While $29 billion may seem like a substantial amount, it has not succeeded in catalysing the level of renewables investment required for Australia to reach net zero. In fact, according to the Clean Energy Council’s Renewable Projects Quarterly Report, funding commitments to large-scale renewable energy in Australia declined approximately 43% from a three-year average of 4.8 GW of capacity per year over 2018–2020, to 2.7 GW per year over 2021–2023 (Figure 7).[29] These investment levels are well below what the Australian Energy Market Operator’s (AEMO) Integrated System Plan (ISP) projects will be required to reach the federal government’s Net Zero targets.
Figure 7. Decline in financial commitments to large-scale renewable energy in Australia (2018-2023).
In response to this slump in renewables investment, the federal government announced in late 2023 that it would expand the Capacity Investment Scheme, that would provide financial support to renewables projects through long-term underwriting agreements. The scheme aims to deliver an additional 32 GW of renewable and dispatchable capacity by 2030 to fill expected reliability gaps as ageing coal-fired power stations exit the energy market. By guaranteeing a revenue ‘floor’ and ‘ceiling’ for selected projects, the scheme intends to reduce financial risks for investors and ensure a steady income stream, thereby making renewable projects more attractive. This initiative is set to supplant the RET, which has struggled to achieve the government’s broader objective of reaching 82% renewable electricity by 2030.
There is very little transparency around the scheme. Neither the floor nor the ceiling revenue thresholds, nor the overall estimated cost of the scheme to taxpayers, will be published. However, given that the scheme has been introduced to address Australia’s current shortage of renewables investment, it seems inevitable that government subsidies for renewables are about to increase dramatically — likely reaching scales at least comparable to the subsidies under the RET. The lack of disclosed financial details raises concerns about the true economic impact of the scheme, challenging the predominant narrative that renewables are cheap.
Conclusion
Our analysis reveals that over the past decade, over $29 billion in subsidies have been provided by the federal government to the renewable energy sector. The dominant source of subsidies has been the Renewable Energy Target scheme, which has seen around $2.7 billion per year channelled towards large-scale and small-scale renewable energy. These subsidies have undeniably played a crucial role in the rapid growth of renewable energy in Australia, increasing its share of electricity supply in the National Electricity Market from less than 1% in 2000 to 39% in 2023.
However, despite the significant investment, the expected level of renewable energy growth necessary for Australia to achieve its net zero targets has not been realised. Funding commitments to large-scale renewable energy projects have instead declined, highlighting the challenges in sustaining the required investment levels.
The introduction of the Capacity Investment Scheme in late 2023 represents a significant step up in the government’s effort to subsidise and incentivise investments in renewables. While this initiative may help mitigate financial risks for investors and attract new investments, the lack of transparency regarding the scheme’s financial details raises concerns about its true economic impact and the feasibility of a renewables-dominated electricity grid.
Ultimately, these findings suggest the need for a critical examination of the efficacy and efficiency of current subsidy frameworks. As Australia continues to pursue its ambitious renewable energy targets, it is crucial to ensure public resources are allocated effectively to support the nation’s energy transition.
The ongoing debate around energy policy, including discussions about the potential role of nuclear power, underscores the importance of evaluating how public resources are used to achieve energy security and affordability.
Endnotes
[1] OpenNEM. https://opennem.org.au. Last accessed 22 Jan 2024.
[2] Bowen, Chris 2023, ‘Delivering more reliable energy for all Australians’. https://minister.dcceew.gov.au/bowen/media-releases/delivering-more-reliable-energy-all-australians.
[3] Snowy Hydro 2023, Securing the Future of Critical Energy Transformation Projects. https://www.snowyhydro.com.au/news/securing-the-future-of-critical-energy-transformation-resets/.
[4] Moran, Alan 2024, ‘The grim cost of firming up solar and wind’. https://amoran.substack.com/p/the-grim-cost-of-firming-up-solar.
[5] As an indication, the NSW Solar Bonus Scheme paid over $1.2 billion to rooftop solar owners from 2010 to 2017, as reported in NSW Climate Change Fund annual reports.
[6] McGowan, Michael 2023, ‘Eraring should remain open beyond 2025: Minns government energy review’. https://www.smh.com.au/politics/nsw/eraring-should-remain-open-beyond-2025-minns-government-energy-review-20230821-p5dy79.html.
[7] Clean Energy Regulator 2024, ‘Renewable power percentage’. https://cer.gov.au/schemes/renewable-energy-target/renewable-energy-target-liability-and-exemptions/renewable-power-percentage. Last accessed 22 Jan 2024.
[8] In practice, most households and small businesses opt to assign the right to create STCs to a registered agent in order to receive an upfront payment at a discount. The agent then handles the creation and trading of these certificates on the open market or through the STC clearing house.
[9] Clean Energy Regulator 2024, ‘Small-scale technology percentage’. https://cer.gov.au/schemes/renewable-energy-target/renewable-energy-target-liability-and-exemptions/small-scale. Data as of 1 December 2023.
[10] Price and transaction volume charts obtained from the Clean Energy Regulator’s Quarterly Carbon Market Reports from 2019 to 2023. Data was extracted manually from the charts as the reports do not include the actual numbers. Note that the annual targets are reported in calendar years, but we estimate the subsidies in financial years to maintain consistency with the rest of the paper. Since the deadline to surrender LGCs is 14 February each year for the previous calendar year, we assume the annual volume of certificates for each financial year corresponds with the previous calendar year. For example, the 19,088,000 LGCs target for 2013 is assumed to be purchased and surrendered in the 2013-14 financial year.
[11] The annual target for LGCs is fixed at 33,000 GWh from 2024 to 2030. As of 21 May 2024, the forward prices for LGCs range from $48 for settlement in 2024 to $18.75 in 2030. LGC forward prices were obtained from Ecovantage at https://www.ecovantage.com.au/large-scale-generation-certificates.
[12] ARENA 2023, ‘Annual Report 2022-23’, p 19. https://arena.gov.au/about/publications/annual-report.
[13] Obtained from ARENA’s financial statements in its annual reports from 2014 to 2023.
[14] DCCEEW 2021, ‘Low Emissions Technology Statement 2021’. https://www.dcceew.gov.au/sites/default/files/documents/low-emissions-technology-statement-2021.pdf
[15] ARENA 2023, ‘Annual Report 2022-23’, p 14.
[16] ARENA 2023, ‘General Funding Strategy 2023-24 – 2025-26’, p 6. https://arena.gov.au/assets/2023/09/ARENA-GENERAL-FUNDING-STRATEGY-2023-24-2025-26.pdf.
[17] ARENA 2024, ‘Record funding for ARENA to supercharge Australia’s net zero transition’. https://arena.gov.au/news/record-funding-for-arena-to-supercharge-australias-net-zero-transition.
[18] Australian Photovoltaics Institute 2023, ‘Silicon to Solar: Foundations for Solar PV Manufacturing in Australia’. https://apvi.org.au/wp-content/uploads/2024/02/S2S-Foundations-for-Solar-PV-Manufacturing-in-Australia.pdf.
[19] Ibid., p 16.
[20] CEFC 2023, ‘Annual Report 2022-23’, p 78. https://www.cefc.com.au/annual-report-2023.
[21] Productivity Commission 2023, ‘Trade and Assistance Review 2021-22’, p 31. https://www.pc.gov.au/ongoing/trade-assistance/2021-22.
[22] Ibid., p 102.
[23] Hehir, Grant 2020, ‘Investments by the Clean Energy Finance Corporation’, The Australian National Audit Office (ANAO), p 68. https://www.anao.gov.au/work/performance-audit/investments-by-the-clean-energy-finance-corporation.
[24] Obtained from CEFC’s financial statements in its annual reports from 2014 to 2023.
[25] DCCEEW 2024, ‘2024-25 Portfolio Budget Statements’, p 188. https://www.dcceew.gov.au/sites/default/files/documents/dcceew-2024-25-pbs.pdf.
[26] Hehir, Grant 2020, ‘Investments by the Clean Energy Finance Corporation’, p 52.
[27] Cambridge Associates 2023, ‘PE and VC Benchmark Index Q2 2023’, p 7. https://investmentcouncil.com.au/common/Uploaded%20files/Research%20-%20Performance%20Benchmarks/AIC_CambridgeAssociates_PEVC_Index_Q2-2023.pdf.
[28] CEFC 2023, ‘Annual Report 2022-23’, p 7.
[29] Clean Energy Council, ‘Renewable Projects Quarterly Report (Q4 2023)’, p 7. Data was extracted manually from the chart as the report does not include the actual numbers.