
Introduction
Many Australians are increasingly concerned by deteriorating housing affordability and its implications for socio-economic outcomes. In a recent survey, 62% of respondents agreed that “continued increases in house prices is bad for the economy and is exacerbating wealth inequality”.[1] In another survey, around two-thirds of respondents agreed that the federal government was not doing enough to address Australia’s housing problems.[2] Analysis by the Australian Bureau of Statistics finds genuine cause for concern, with rates of home ownership for those aged 25-39 years falling from 66% to 55% in the period from 1991 to 2021.[3]
Such concerns are increasingly reflected in policy, with a recent federal government report observing that “rising housing costs” pose “challenges for many young Australians”.[4] The same report pointed to a need for housing supply to be “responsive to demand”, especially in locations that are accessible to jobs. There is indeed growing evidence that housing policy reforms can increase supply and support affordability. Perhaps most notably, rates of housing supply in New Zealand have — after a decade of reform — surged past Australia. For these reasons, this paper reviews New Zealand’s reforms and considers potential lessons for Australia.
First, the paper summarises the context to housing policy reforms in New Zealand, which have sought to streamline planning processes and enable housing in desirable locations, a process known as ‘upzoning’. The term is used here to describe changes to planning policies that enable more housing to be built, such as increased building height limits. A recurring theme in New Zealand’s housing policy reforms has been the potential distributional effects of upzoning — that is, who ‘wins’ and ‘loses’. Growing awareness of the distributional benefits of housing appears to have fostered broad-based support for reforms in New Zealand.
The paper then briefly reviews empirical evidence on the impacts of New Zealand’s housing reforms. These effects are apparent from even a cursory comparison of housing outcomes in councils that have upzoned versus those that have not. In 2023, for example, upzoned councils in Auckland, Canterbury, and Lower Hutt have accounted for around two-thirds of all the dwelling consents issued in New Zealand, which is much more than their share of the population. Several credible economic studies find upzoning supported large and rapid improvements in housing affordability as well as a rapid expansion in social housing.
Thirdly, the paper presents some preliminary analyses of New Zealand’s housing policy reforms. Whereas dwelling growth in Canterbury and Auckland initially lagged population growth, after each region was upzoned in 2011 and 2016, dwellings have grown faster than population. Moreover, analysis of data from Auckland shows the population of people aged 20-34 years grew most strongly in areas that experienced the most upzoning, and vice versa for those aged 65+ years. While more research is needed, these preliminary analyses suggest young people may have disproportionately benefited from these reforms, where benefits likely represent a ‘double dividend’ of more affordable housing and better access to jobs and amenities.
There have been several recent overviews of New Zealand’s housing reforms, including Maltman (2023), Greenaway-McGrevy (2024), Blick and Stewart (2024) and Politano (2024). These summaries focus on estimates of the effects of Auckland’s Unitary Plan. Like this paper, they agree that upzoning led to large increases in construction and improvements in affordability. This paper updates this earlier work, provides a broader context, and is targeted at a broad Australian audience.
To conclude, this paper argues that Australia can learn from New Zealand’s experience: enabling more housing can quickly lead to more supply and improved affordability.
To listen to this research on the go, subscribe on your favourite platform: Apple, Spotify, Amazon, iHeartRadio or PlayerFM.
Background to New Zealand’s housing policy reforms
Since 2011, successive New Zealand governments have advanced housing policy reforms that seek to streamline approval processes and enable more housing. Notwithstanding some differences, governance structures in Australia are sufficiently similar to New Zealand for the latter’s experience to provide salient insights for efforts to progress policy reforms in Australia.[5]
Table 1 summarises several key events that have contributed to New Zealand’s supply-side housing reforms from 2011 to the present, which are subsequently expanded on below.
Table 1: Key events that contributed to New Zealand’s supply-side housing reforms 2011 – 2024
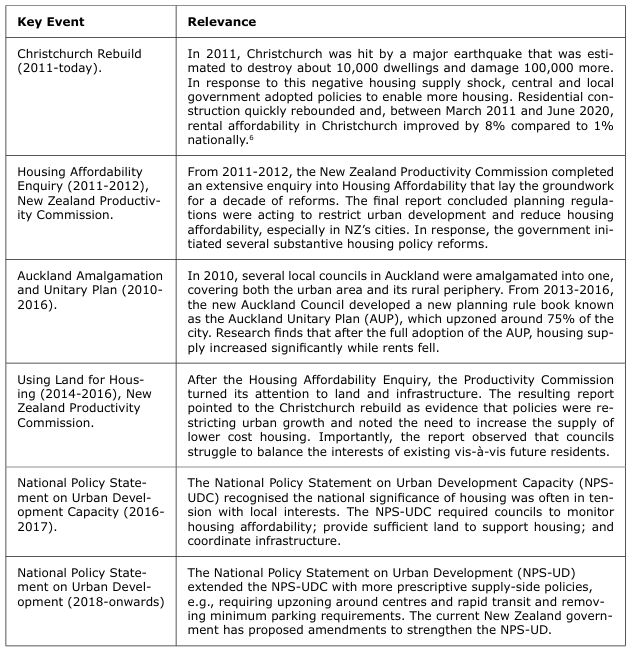
In many respects, the origins of NZ’s housing policy reforms can be traced to the Housing Affordability Enquiry (HAE) undertaken by the NZ Productivity Commission, for which the final report was published in 2012.[7] The HAE report notes:
“There is a concern that real (inflation-adjusted) house prices in New Zealand are markedly higher than they were a decade ago and that this has been associated with general declines in housing affordability and home ownership rates.”
The report identified many factors that had contributed to deteriorating housing affordability in NZ, but reserved especially pointed criticism for the role of planning policies (p. 9):
“The prevailing approach to urban planning in New Zealand reduces housing affordability in our faster growing cities. The widespread planning preference for increasing residential density, while at the same time imposing restrictions such as minimum lot size and height restrictions, and limiting greenfield development, places upward pressure on house prices across the board. Constraints on the release of new residential land create scarcity, limit housing choice, and increase house prices.”
Importantly, younger cohorts are a focus of the commission’s final report.[8] The report notes that home ownership rates in NZ peaked at 75% in the late 1980s before declining to 65% by 2010. For people aged 25-34 years, however, the decline was even more precipitous, with home ownership rates falling from around 70% to 40% over this period.
The HAE report appears to have precipitated a rapid change in the types of housing policies that were deemed politically acceptable. The dramatic change in language during this period is underscored by Figure 1, which shows that ‘housing’ is mentioned two to three times more frequently in budget speeches from 2013 onwards.[9]
Figure 1: Budget Speeches by Ministers of Finance 2000 to 2024 – number of times ‘housing’ was mentioned. The purple line is a 3-year average
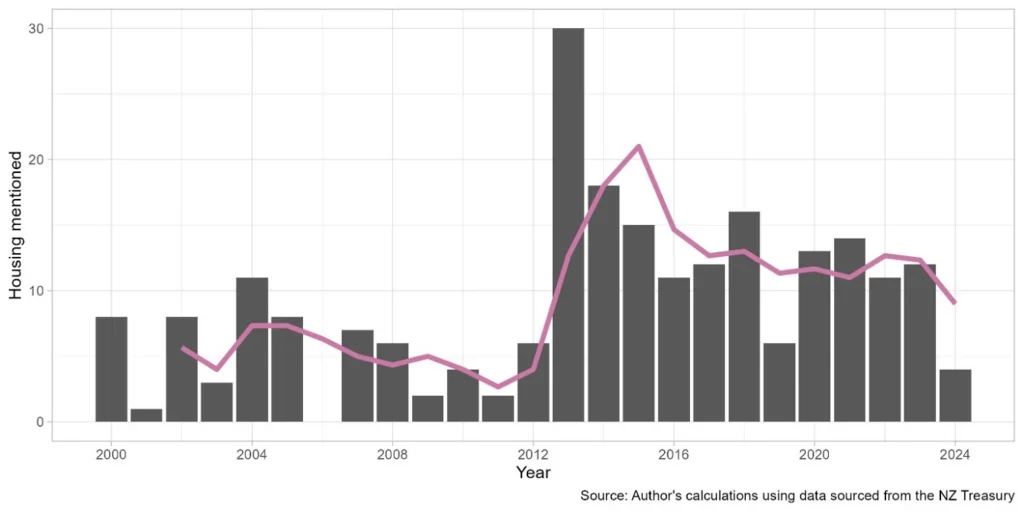
Research finds a similar step-change in the use of the term ‘housing crisis’ by opposition parties in parliament.[10] Within six months of the HAE report, NZ’s centre-right government had proposed policy reforms to expedite approvals and enable development.[11] In an accompanying press release, the then Minister of Finance stressed the distributional effects of the reforms, noting “… today’s announcements on housing affordability will reduce housing stress and enable the housing market to better meet the needs of middle- and low-income New Zealanders”.[12]
By linking evidence to policy and highlighting the regressive distributional effects of deteriorating housing affordability, the HAE report — and the government response it elicited — appears to represent a turning point in contemporary housing policy in NZ. In this context, it is encouraging to see similar institutions in Australia — like the NSW Productivity and Equality Commission — begin to make similar contributions to the housing discourse.[13]
Around the same time as the HAE, housing policy reforms in NZ appear to have benefited from two unusual but important events. First, policies adopted to rebuild Christchurch after the 2011 earthquake had started to bear fruit, with building approvals increasing rapidly.[14] Second, the amalgamation of councils in Auckland in 2010 created the need for a new set of planning rules, namely the Auckland Unitary Plan (AUP), which in turn provided an opportunity to accelerate upzoning. In a media announcement, the then Minister of Housing noted:
“This bill … confronts the reality that homeownership rates have been in decline for a quarter of a century, that house prices have soared unsustainably over the past decade, and that for too many families, buying or renting a home is unaffordable.”[15]
Like with the HAE, the distributional effects of deteriorating housing affordability are presented as a key motivation for the proposed policy reforms.
Although the AUP ultimately played a key role in New Zealand’s housing reforms, Auckland Council’s original proposal in 2013 was heavily criticised for the widespread use of low-density zoning, especially in central locations most suited to development.[16] Following lengthy hearings, an independent hearings panel (IHP) — appointed by central government — sided with these critics and recommended Auckland Council amend the AUP to enable twice as much housing as they had proposed, most notably by extending medium-density upzoning to more locations.[17]
While the AUP is now seen as a success, Auckland’s experience supports the view that many councils will struggle to adopt housing policy reforms on their own. In Auckland, upzoning was achieved only after concerted pressure from a broad coalition of central government organisations, professional institutions, property owners, and advocacy groups. West (2024) reviews the contribution of the latter, in which young people were a critical driving force.[18] In Australia, efforts to advance housing policy reforms would likely benefit from a similarly broad-based coalition. The recent establishment of several housing advocacy groups, apparently underpinned by the efforts of young people, provides reasons to be optimistic on this score.
In 2015, the NZ Productivity Commission again entered the chat with another important contribution to the housing policy debate. Its final report from the Using Land for Housing enquiry (ULHE) reiterated and expanded on several earlier points (p. 15):
“Planning systems and land regulations … affect the speed and efficiency with which land is made available for housing, including through more intensive use of land within existing city boundaries. Constraints on the release of new residential land and restrictions on the more intensive use of existing residential land create scarcity and have the effect of limiting housing choice and increasing house prices.”[19]
The ULHE report again elicited a response from the government, which this time recommended the development of a National Policy Statement on Urban Development Capacity (NPS-UDC).[20] As documented in detail in West (2024), the Productivity Commission’s work on the HAE and ULHE helped to foster an “evidential consensus” that housing policy was of national significance.
In the meantime, building approvals continued to hit record highs, with the then Minister of Housing observing, “This is the longest and strongest period of growth in residential construction in New Zealand history … This is important because supply is at the core of New Zealand’s challenges around affordable, social, and emergency housing”.[21] Notwithstanding the positive news, most of the growth in building consents at this time was driven by the Christchurch rebuild.
The NPS-UDC was then published in October 2016 and sought to broaden the scope of housing policy reforms by setting expectations that all councils should assess feasibility, monitor prices, and provide land for housing.[22] Although the NPS-UDC was a significant policy milestone, its focus on monitoring gave rise to concerns that it was insufficient to compel councils to change (for a detailed discussion, see p. 7 in West, 2024).
Despite these tangible signs of progress in New Zealand, the Prime Minister John Key — who had just the year before been re-elected for a third term — was widely criticised in 2015 for suggesting the country did not have a housing crisis.[23],[24] Given that NZ consistently ranked at the bottom of the OECD’s housing affordability indicators, Key’s comments appeared out-of-step with both the evidence and, as was increasingly evident, the prevailing public mood.[25]
Indeed, by the time of the general election in 2017, surveys ranked housing affordability at the top of the most important problems facing NZ.[26] The rapid shift in public opinion on housing affordability — even during a period of sustained reforms and tangible progress — serves as a warning for federal and state governments in Australia. Specifically, in an environment where housing affordability is deteriorating there are political risks associated with progressing too slowly with supply-side housing policy reforms. As well as losing support, governments that do not address housing affordability would seem to risk opening the door to populist demand-side policies, which can misdiagnose the root causes of the problem and cause even more harm.
In 2017, the centre-right government that had overseen more than five years of increasingly ambitious and apparently effective supply-side housing policy reforms in NZ lost the election to a resurgent Labour Party. Notably, Labour’s 2017 manifesto did not mention planning reforms, but it did include a major housing policy called KiwiBuild, which sought to subsidise the delivery of 100,000 new affordable homes. Although surveys found KiwiBuild was popular with voters, the program continually struggled to hit targets and by July 2019 had delivered fewer than 300 dwellings.[27],[28] KiwiBuild’s struggles hint at potential limits on the effectiveness of government subsidies for affordable housing, at least at times when construction activity is already elevated. This experience may be relevant to the design and implementation of similar policies in Australia.
In addition to KiwiBuild, however, the Labour-led government progressed a broad program of reforms to housing governance and policy, including increased investment in social housing and more financial support for low-income households.[29] In 2018, a Ministry of Housing and Urban Development was established, for which the accompanying press release noted:[30]
“Addressing the national housing crisis is one of the biggest challenges our Government faces. The new Ministry will provide the focus and capability in the public service to deliver our reform agenda … Too many New Zealanders are hurting because of their housing situation. Many are locked out of the Kiwi dream of home ownership. Others are homeless or suffering the health effects of poor-quality housing.”
At this time, building consents continued to soar, with the recently-upzoned Auckland beginning to take over from Christchurch as the latter’s rebuild started to taper off.[31] The then Minister of Housing and Urban Development noted the wider implications of housing supply for affordability:
“Figures released today show that wages are rising faster than house prices … Today’s figures are great news for families locked out of homeownership and for those first home buyers currently in the market.”[32]
Despite the change in government, media releases continued to emphasise the distributional impacts of housing policy reforms, especially for first home buyers and families.
NZ’s Labour-led government also progressed several supply-side housing policy reforms. Perhaps the most important of these was replacing the NPS-UDC with a new National Policy Statement on Urban Development (NPS-UD), which included more prescriptive policies, such as the removal of minimum parking requirements in urban areas and the requirement to allow building height limits of at least six storeys around centres and rapid transit stops.[33]
After the NPS-UD, the two largest political parties in parliament — namely Labour and National — collaborated on the development of the Medium Density Residential Standards (MDRS). The MDRS went further than the NPS-UD by requiring councils to allow three dwellings of three-storeys in most urban areas. At the time of writing, nine urban councils had already implemented both the NPS-UD and the MDRS, while another three were in line to do so,[34] meaning the take-up of both measures are only now likely to be affecting building approvals.
In some respects, the NPS-UDC, NPS-UD, and MDRS heralds the emergence of relatively broad-based political support for supply-side housing policy reforms in NZ.[35] This broad-based support stands in stark contrast to the more acrimonious housing discourse in Australia, where the NSW state government’s proposals to upzone around rapid transit, for example, have been opposed by opposition parties in parliament.[36] There would seem to be value in fostering more cross-party political support for supply-side housing reforms in Australia.
Prior to winning the 2023 election in NZ, however, the National Party unexpectedly retracted support for the MDRS, ostensibly because it was not suitable for some councils. Despite this setback, recent announcements suggest the new National-led government intends to advance alternative supply-side housing policy reforms via amendments to strengthen the NPS-UD, such as enabling more housing capacity, automatic triggers for the application of mixed-use zoning, and the removal of minimum area requirements for dwellings and balconies.[37]
In short, the rate of housing supply in NZ has surged to record levels following a raft of policy reforms extending back for much of the last decade, which have in turn been progressed by several governments. Work to implement and develop further reforms is ongoing.
The impacts of New Zealand’s housing reforms
This section considers the impacts of New Zealand’s housing policy reforms by, first, comparing housing supply in New Zealand to Australia and, second, by considering detailed economic studies of the impacts of policy reforms in two councils, namely Auckland and Lower Hutt.
A national perspective
To provide a national perspective, Figure 2 compares dwelling approvals per 1000 residents for NZ and Australia in the period from 2000 to 2024. In this period, both countries have experienced broadly comparable rates of population and income growth.
Figure 2: Dwelling consents / approvals in NZ and Australia, respectively, 2000-2024*
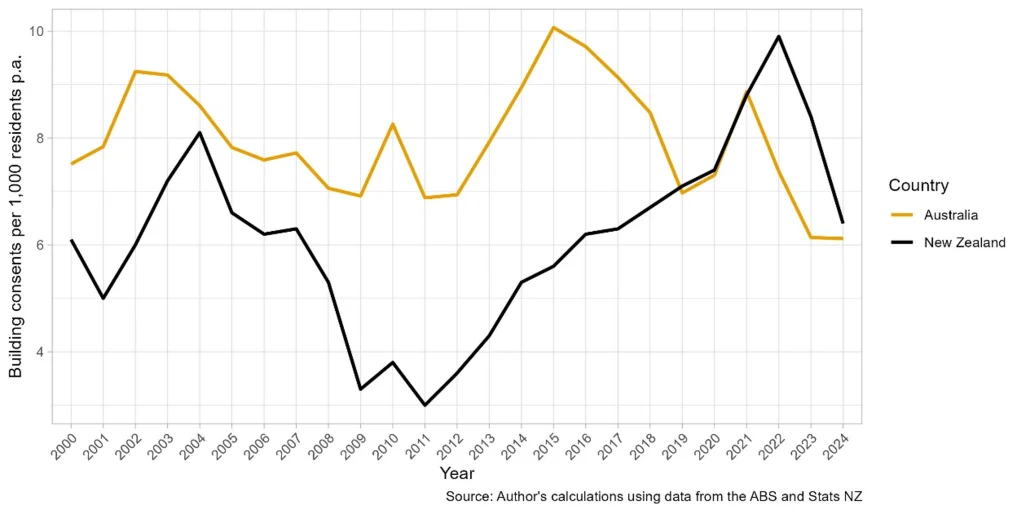
*Notes to figure: the 2023 and 2024 data is provisional.
Whereas Australia consistently achieved higher levels of dwelling approvals in the period from 2000-2018, it has been surpassed by NZ from 2019-2024. After a nadir in 2011, dwelling approvals in NZ have grown steadily to reach their highest levels in decades. Although they have fallen from 2022 onwards due to higher interest rates and increased construction costs, dwelling approvals in NZ remain at levels that are above or around their long run averages.[38] In terms of dwelling composition, multi-unit dwellings comprised 58% of all dwellings in NZ in 2023 versus only 18% in 2013. In 2023, the comparable share of multi-unit dwellings in Australia was 38%.
This growth in dwelling approvals has been accompanied by a large expansion in the size of NZ’s construction sector, which now accounts for 10.7% of employment versus 9.3% in Australia. Indeed, from 2013 to 2023 the number of people employed in construction in NZ more than doubled, with average growth rates above 5% pa, while the number of people in apprenticeships effectively tripled. Together, this data suggests the size of NZ’s construction sector has quickly scaled up in the wake of policy reforms.[39]
Both the NPS-UD and MDRS discussed in the previous section were subject to detailed economic appraisals. These appraisals found both policies were likely to increase housing supply and improve affordability, with economic benefits that exceeded their costs by a significant margin.[40] As the NPS-UD and MDRS have only recently been adopted, they are unlikely to have affected housing data presented in this study and are instead expected to show up in future releases.
Disaggregating data on building approvals for regional and local councils in NZ reveals a clear picture: much of the growth in dwelling consents at the national level has been driven by the places that adopted supply-side housing policy reforms, namely, the Auckland and Canterbury regions and Lower Hutt, as shown in Figure 3. To put these trends in context, in the last 12 months, these three councils have accounted for around two-thirds of all building consents issued in NZ, which is considerably more than their share of the population (around 48%). In Figure 3, the black line for the ‘Rest of NZ’ reveals how almost all the increase in dwelling approvals in NZ has been driven by councils that upzoned.
Figure 3: Dwelling consents in upzoned councils versus non-upzoned councils in NZ 2000-2024*
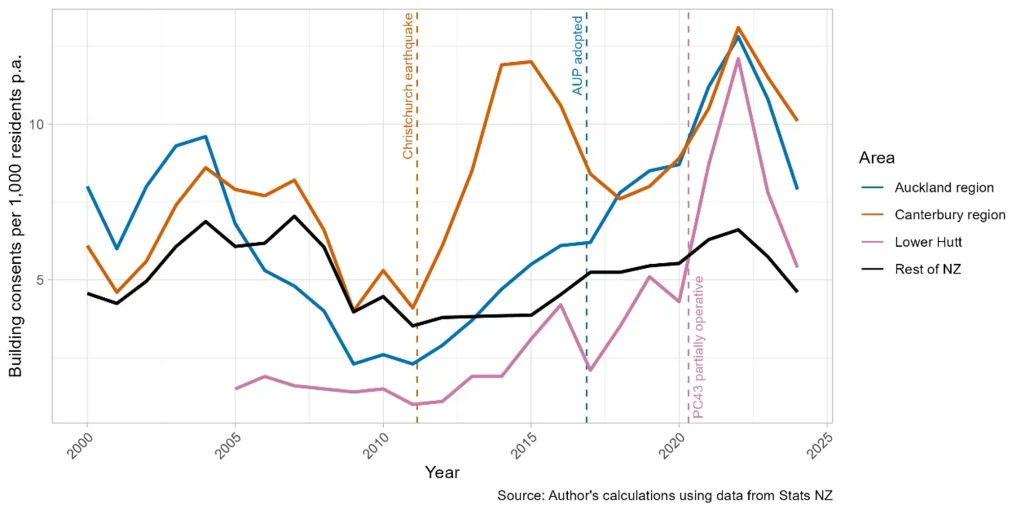
* Notes to figure: some data for 2022-2024 is provisional and may be subject to revisions.
The following sections examine the upzoning reforms in Auckland and Lower Hutt in more detail.[41]
Upzoning case studies
Auckland
A large and rapidly growing body of economic evidence finds that upzoning in Auckland has led to increased housing supply and lower rents (see textbox for a background to upzoning in Auckland). Some of the key studies that make up this body of evidence include:
- Greenaway-McGrevy and Phillips (2023) compares dwelling consents in upzoned and non-upzoned areas of Auckland before and after the adoption of the AUP in 2016. Their results suggest the AUP led to an additional 21,803 consents after five years, which equates to about 4% of Auckland’s existing dwelling stock.
- Greenaway-McGrevy (2023) compares dwelling consents over time in Auckland to other cities in New Zealand that were similar to Auckland but did not upzone. The results imply the AUP led to an additional 43,500 consents after six years, which equates to about 9% of Auckland’s existing dwelling stock.
- Greenaway-McGrevy and Jones (2023) shows the increase in consents that followed the AUP was predominantly infill (construction of new buildings on underutilised or vacant land in existing urban areas) or attached housing. Growth was also concentrated in locations closer to the city centre, employment centres, and transportation networks.
- Jones, Greenaway-McGrevy, & Crow (2024) uses council valuation records to analyse changes in Auckland’s housing stock. The results indicate there were about 598,000 dwellings in Auckland in February 2024, which is an increase of about 80,000 units — or 15% — since the AUP became operative in November 2016.
- Greenaway-McGrevy (2024) considers the impacts of upzoning under the AUP on the supply of social (state) housing. The results show the share of social housing grew even faster than the supply of private dwellings, with the share associated with social housing more than tripling from 3% to 10% of all dwelling consents.
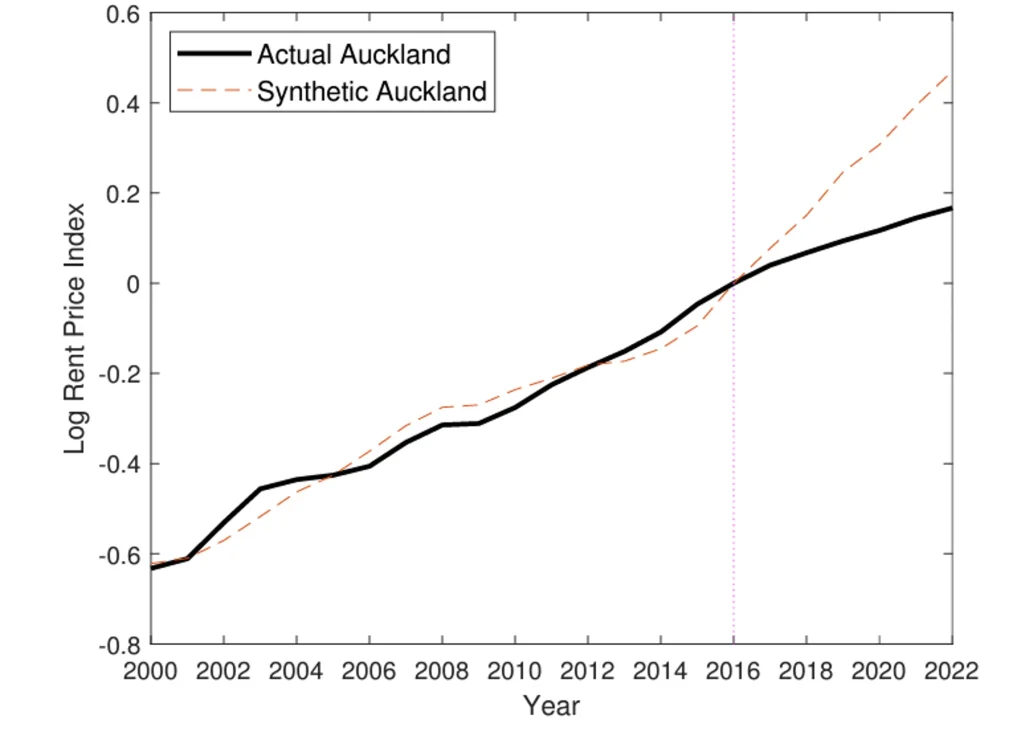
- Greenaway-McGrevy and So (2024) compares rents in Auckland to other similar cities in New Zealand that did not upzone. After adjusting for observable differences in the quality of housing, the report finds that — after the adoption of the AUP — rents in Auckland were 28% lower than they would have been without upzoning.
- Greenaway-McGrevy (2024) specifies an urban economic model and uses it to analyse the long-run effects of upzoning in Auckland. Under plausible assumptions, results imply that upzoning led to a 24% increase in floorspace and a 15-27% fall in house prices. The magnitude of the latter finding aligns closely with Greenaway-McGrevy and So (2024).
- Donovan and Maltman (2024) assesses some of the evidence on upzoning in Auckland and finds it is robust to critiques. Notably, the results show that housing completions in Auckland have also hit record highs, closely matching trends in dwellings consents.
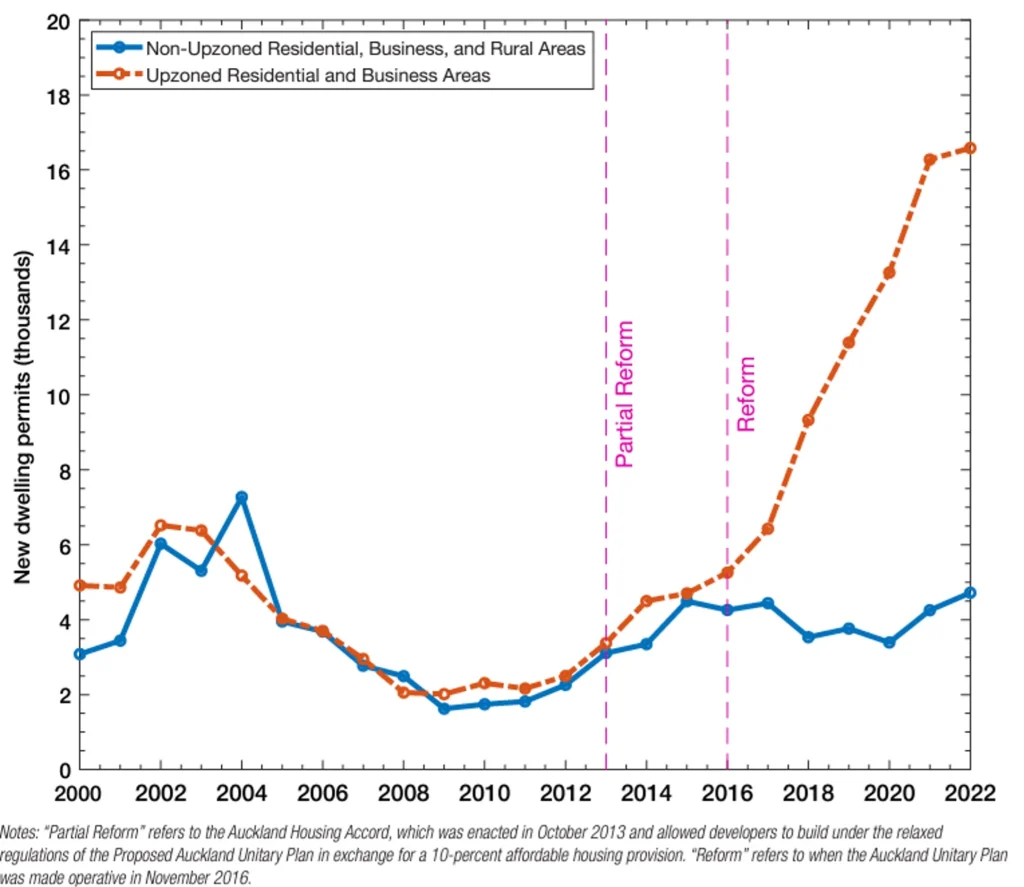
Taken together, these economic studies provide extremely strong evidence the AUP led to a significant increase in housing supply — including private and public dwellings as well as floorspace — and a significant reduction in rent. Moreover, as shown in Figure 4, these impacts on housing supply and rents were realised relatively rapidly following upzoning.
Figure 4: Effects of the AUP on housing supply and rents (Source: Greenaway-McGrevy, 2022 and Greenaway and So, 2024)[42]
At the time of writing, Auckland provides the most well-studied example of major zoning reforms globally. And, somewhat fortunately for Australia, it happened right in our backyard.
Some of Greenaway-McGrevy and Phillips’ (2023) methods and findings have been challenged in blog posts by Cameron Murray and Tim Helm, which have subsequently been reiterated by Wellington’s Independent Hearing Panel and others. However, Murray and Helm’s comments have been criticised (see The Spinoff, 2024). Donovan and Maltman (2024) assess Murray and Helm’s comments in detail and find them to be without merit. Instead, Donovan and Maltman (2024) find the available evidence shows Auckland’s zoning reforms contributed to increased rates of housing consents and completions compared to other NZ cities that did not upzone. Moreover, increased housing construction occurred precisely in the locations that had been upzoned and of the types of housing, notably townhouses, which were enabled by the AUP.
To my knowledge, no authoritative economist has endorsed Murray and Helm’s arguments or disagreed with Donovan and Maltman. The weight of expert opinion is indicated by a poll of the New Zealand Association of Economists (Wesselbaum, 2024) which asked its members whether “land use restrictions in district plans reduce housing supply.” Ninety-six per cent of respondents agreed or strongly agreed. The Spinoff’s (2024) headline summarises: “Survey shows almost every economist in NZ disagrees with Wellington’s housing panel”.
Two conclusions follow from this: First, the weight of research and expert opinion overwhelmingly agrees that zoning reforms increase housing supply and reduce housing costs and, second, the evidence on the effects of upzoning in Auckland has proven to be robust to criticism.
Background to the AUP
As documented in Greenaway-McGrevy and Jones (2023), Auckland is the largest urban region in New Zealand, with a population of 1.7 million in 2023. The city is growing relatively fast, with an average population growth rate of around 1.9% p.a. since 2001.[43]
Before 2010, local government in Auckland comprised seven councils, each of which was responsible for developing its own planning policies. After 2010, however, these seven councils were amalgamated into a single jurisdiction, namely Auckland Council. The new council area covered 4894 square kilometres, including the metropolitan area, several towns, populated islands, and a relatively large rural periphery. It was tasked with developing a single set of planning policies for the whole region, which became known as the AUP.
From 2013-2016, Auckland Council developed and consulted on the AUP, which was then considered by an Independent Hearings Panel, or IHP. In its final report, the IHP recommended Auckland Council amend the proposed AUP to enable more housing. The IHP’s recommendations were partly informed by its own analysis of development feasibility, which was premised on significantly more conservative assumptions than those used by the council.
The current version of the AUP became operational on 15 November 2016 and resulted in the introduction of new residential zones. Table 2 in the Appendix to Greenaway and Jones (2023) summarises the policies in each zone, such as height restrictions. The upzoning enabled by the AUP is best described as broad but modest. That is, the AUP upzoned broadly across about three-quarters of Auckland’s urban land, but the increase in allowable development density was quite modest. Indeed, much of the urban area continued to be subject to height limits of three storeys, or less. This upzoning model likely explains why the AUP predicted an increase in the development of townhouses, more so than apartments.
Lower Hutt
While Auckland Council, somewhat reluctantly, was muddling its way through the AUP process, one suburban council in Wellington, namely Lower Hutt, chose to upzone of its own accord.[44]
Lower Hutt forms part of the Wellington region and, with a resident population of 114,000 in 2023, is currently the sixth largest council in NZ. As documented in Maltman and Greenaway-McGrevy (2023), Lower Hutt has, since 2010, adopted a series of policy reforms to enable more housing. In November 2017, Lower Hutt adopted a major policy change that sought to enable medium- and high-density housing in residential areas more widely across the city.
Using similar methods to those adopted in Auckland, Maltman and Greenaway-McGrevy (2023) analyse the effects of these policy changes on dwelling consents and find:
“… Depending on how potential displacement effects are accounted for, the Lower Hutt reforms increased housing starts across the wider metropolitan region by approximately 10 to 18%. We also present evidence that the upzonings reduced rents by around 21% relative to the counterfactual.”
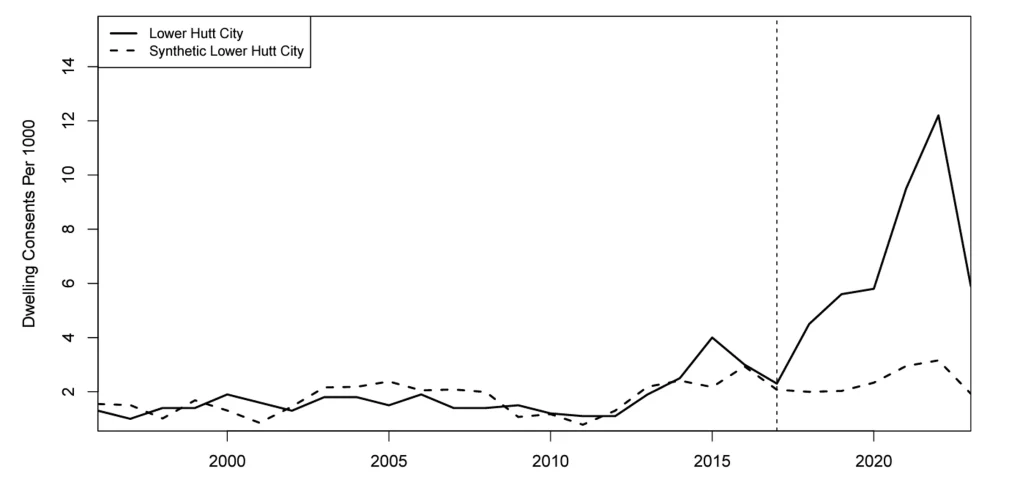
Figure 5 illustrates the effects of zoning reforms in Lower Hutt on consents (solid line) compared to what we might have otherwise expected (dashed line). Like the studies for Auckland, the authors find that upzoning had a large and rapid positive effect on dwelling consents.
Figure 5: Synthetic and actual consents per 1,000 residents for Lower Hutt (Source: Maltman and Greenaway-McGrevy 2024)
Lower Hutt also has recently adopted further upzoning reforms required by NPS-UD and MDRS provisions, which became operative in September 2023 — ahead of any other council in New Zealand. As such, there would appear to be value in continuing to monitor housing outcomes in Lower Hutt to see whether it gets another boost from this more recent upzoning.
Implications for young people
As the distributional effects of NZ’s housing reforms for young people have not yet been the subject of detailed economic studies, this section presents preliminary analyses for the purposes of stimulating discussion — more detailed research is required to verify these effects.
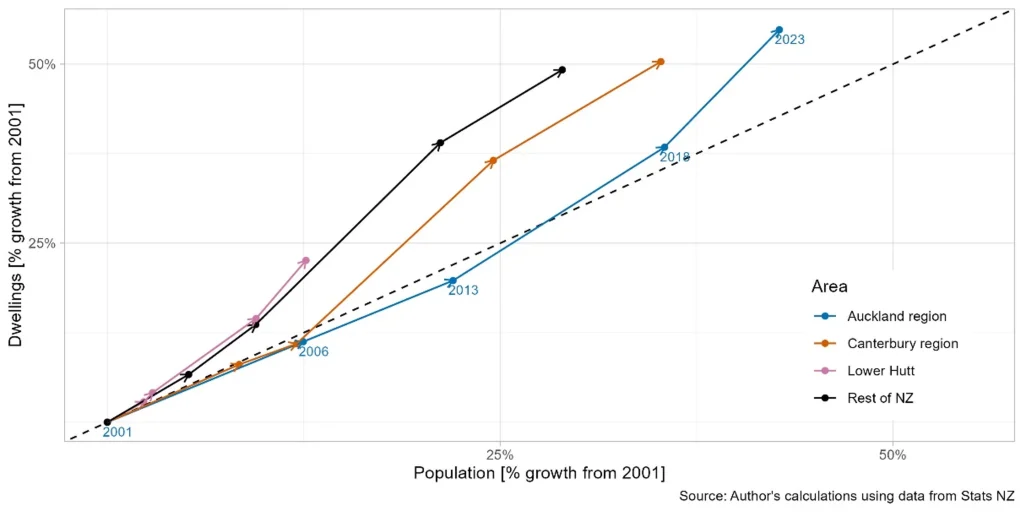
To begin, Figure 6 plots growth in dwellings versus growth in the resident population for the period from 2001-2023, with values indexed to the beginning of the period. [45] Areas above the dashed 45-degree line denote locations where dwellings grew faster than the population, and vice versa for locations below the line. Initially, and unlike the Rest of NZ, we see that dwelling growth in the Auckland and Canterbury regions failed to keep up with population growth.
In both Canterbury and Auckland, however, dwelling growth increases follow the adoption of housing policy reforms in 2011 and 2013-16, respectively. The change is sufficiently strong to quickly outstrip population growth and move these places back above the 45-degree line. Further research would ideally seek to understand whether these changes have contributed to smaller average household size, increased household formation, and/or reduced crowding.
Figure 6: Dwelling growth versus population growth 2001-2023 [indexed to 2021 values]
An analysis of upzoning in Auckland also reveals a change in age demographics. Figure 7 compares population growth for people aged 20-34 years and 65+ years versus the extent to which a neighbourhood (SA2) was upzoned. Neighbourhoods in Auckland that experienced little to no upzoning (towards the left side of the figure) saw higher than average growth in people aged 65+ years and lower than average growth in people aged 20-34 years. The opposite result is found for those neighbourhoods in the highest quintile of upzoning (towards the right side of the figure), where growth in the population of people aged 20-34 years is much higher than average.
Figure 7: Population growth versus upzoning quintile for sub-populations aged 65+ and 20-34 years in Auckland
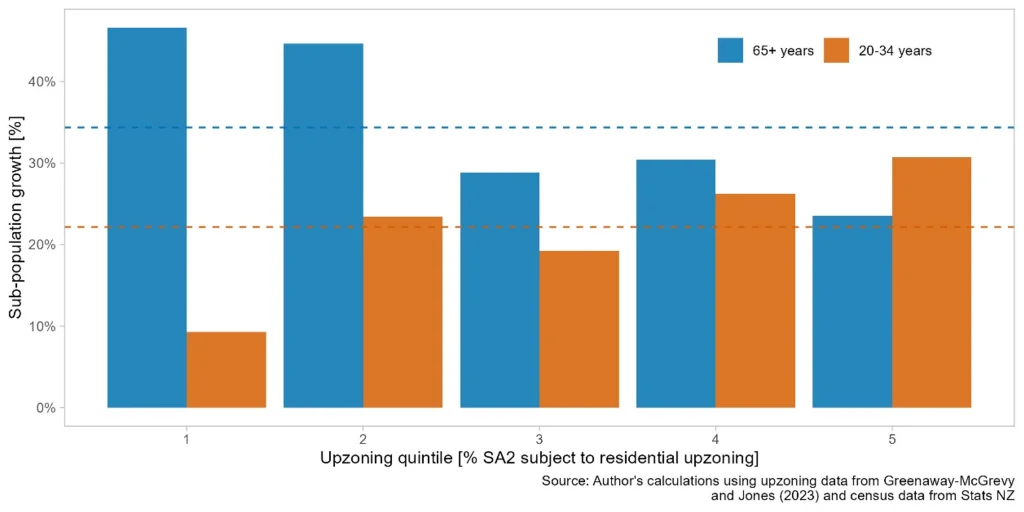
Together with other evidence, this preliminary analysis implies that young people may have disproportionately benefited from upzoning. The benefits of upzoning are, moreover, likely to manifest over multiple margins, such as more affordable housing and improved access to jobs and amenities. The urban economic literature provides strong evidence on the productivity benefits of working in cities, which are especially important for young people.[46],[47]
For this reason, housing policies that enable more young people to live in cities, like those pursued in Auckland and other parts of NZ over the last decade, could potentially have significant implications for the wellbeing and productivity of young people. Looking forward, there is value in further research to better understand these distributional effects.
Conclusions
Despite recent notable success, housing affordability outcomes in NZ remain extremely poor. According to the OECD’s Better Life Index, NZ households on average spend 26% of their gross adjusted disposable income on housing, which is the highest in the OECD, where the average is 20%.[48] The comparable figure for Australia is 19%.[49] Given these differences in affordability, one might ask why Australia should look to somewhere like NZ for insights into housing policy?
There are five answers to this question.
First, while housing affordability in NZ remains relatively poor, the direction of travel is more positive. Building approvals for new dwellings in NZ have, since 2021, exceeded those in Australia for the first time in recent decades. Similarly, while house prices in Australia rose by more than 8% in 2023, prices in NZ fell by more than 3%, with a fall of more than 5% recorded in Auckland.[50] Of course, more time is needed to know whether these recent changes in relative housing outcomes are sustained, but even current outcomes represent a significant change from the historical trajectories for housing in NZ vis-à-vis Australia.
Second, because it has faced housing affordability problems for longer, NZ has gained significant experience with what works, both in terms of communication and policy. Notably, the distributional effects of housing affordability have been prominent in public communications on policy reforms. In response to a recent question on whether house prices should fall, for example, NZ’s current Minister of Housing and Urban Development replied as follows:[51]
“Yes. We want housing to be more affordable for New Zealanders. That is a major work stream for this government — average house prices in NZ are too expensive. The flipside of house prices falling for people who own homes, is that they become more affordable for people who don’t own homes”.
In my view, the sustained emphasis on the distributional benefits of housing reforms is likely to reflect not just the political salience of this messaging but also the real impacts of deteriorating housing affordability. Similarly, on the policy front, NZ’s experience highlights the benefits of supply-side reforms in locations with high demand. Other well-intended policy initiatives, such as government subsidies for affordable housing construction, have proven less effective.
Third, NZ’s experience suggests federal and state governments in Australia need to assert their legitimate interests in housing policy. Auckland’s upzoning, for example, was a stunning success, but it was opposed by many in the council at the time and almost did not proceed. More generally, there is a well-documented political problem whereby housing has dispersed benefits but concentrated costs, reducing incentives for local government to enable more residences. In NZ, this awareness has prompted national intervention, such as the NPS-UD, which essentially seeks to override local decisions in specific locations and in specific ways. In my view, federal and state governments in Australia have legitimate reasons to override local interests on housing policy.
Fourth, and notwithstanding the last point, federal or state government intervention in local decisions needs to be carefully targeted. While one must be wary of reading too much into one decision, the unravelling of the previously bipartisan political consensus on the more prescriptive MDRS in NZ hints at the limits to top-down reforms. In contrast, there seems to be broad political support in NZ to strengthen the NPS-UD provisions on upzoning around urban centres and public transport, which are similar to proposals in Sydney and Melbourne. Policy reforms would thus ideally recognise that federal and state governments have a legitimate interest in housing outcomes, while also seeking to address the incentives facing local councils. Notably, NZ’s central government has recently proposed to financially reward councils for delivering housing. These payments reflect growing awareness that local councils bear the costs of growth — both financially and politically — while most of the benefits flow to higher levels of government.[52]
Fifth, evidence matters — both evidence on the effects of housing policies as well as evidence of public support for housing. The effects of Auckland’s upzoning, for example, have been studied in detail and provided a strong foundation for subsequent policy reforms. Similarly, representative surveys have tended to reveal broad support for housing that may be sufficient to sway some decision-makers. For this reason, organisations that wish to progress housing policy reforms would be well-advised to invest in gathering evidence, for example by funding research and representative public surveys. Further research into the distributional effects of upzoning as well as international comparisons of housing outcomes between countries would seem to be especially useful for advancing the discussion.
References
[1] Centre for Equitable Housing. (2023). “The Australian Housing Monitor”. Retrieved from https://centreforequitablehousing.org.au/wp-content/uploads/2023/03/Housing-Monitor-Report-1-VF-smaller.pdf
[2] The Australia Institute. (2023). Polling: Housing Policy. Retrieved from https://australiainstitute.org.au/report/polling-housing-policy/
[3] Australian Bureau of Statistics. (2023). Back in my day: Comparing millennials with earlier generations. Retrieved from https://www.abs.gov.au/articles/back-my-day-comparing-millennials-earlier-generations
[4] Australian Government. (2023). “Intergenerational Report 2023 – Australia’s future to 2063”. Retrieved from https://treasury.gov.au/sites/default/files/2023-08/p2023-435150.pdf
[5] The main difference is the New Zealand government has the combined legislative authority of both the federal and state governments in Australia. This centralisation of legislative authority is further reinforced by New Zealand’s unicameral parliament. Compared to Australia, the New Zealand government has “comparatively universal legislative power”, which enables it to rapidly implement major legislative changes. See 5 differences between the Australian Federal and New Zealand for more details.
[6] See page 8 of Cabinet-Paper-Fixing-the-Housing-Crisis.pdf (hud.govt.nz)
[7] New Zealand Productivity Commission. (2024). “Housing affordability inquiry”. Retrieved from https://www.treasury.govt.nz/sites/default/files/2024-05/pc-inq-ha-final-report-v5.pdf
[8] The words “children”, “young”, and “families” feature prominently in the Commission’s final report, being mentioned 28, 33, and 55 times, respectively. Examples of this emphasis include, “Housing affordability is lowest among those who are younger …” (p. 4); “Put simply, declining affordability falls unduly on young families …” (p. 23); “… affordability constraints have become more binding for a growing share of households, who tend to be young and/or with relatively low incomes” (p. 39); and “Poor-quality rental accommodation and insecure tenure have a detrimental impact on tenants, particularly older people and families with children” (p. 204).
[9] Analysis finds a similarly-timed increase in the frequency with which “young” and “children” are used.
[10] White, I., & Nandedkar, G. (2021). The housing crisis as an ideological artefact: Analysing how political discourse defines, diagnoses, and responds. Housing Studies, 36(2), 213-234.
[11] New Zealand Government. (2012). Improving Housing Affordability. Retrieved from https://www.beehive.govt.nz/feature/improving-housing-affordability
[12] New Zealand Government. (2012). Govt receives housing affordability report. Beehive.govt.nz. https://www.beehive.govt.nz/release/govt-responds-housing-affordability-report
[13] Productivity Commission of New South Wales. (2023). Building more homes where people want to live. Productivity NSW. https://www.productivity.nsw.gov.au/sites/default/files/2023-12/202305_02-building-more-homes-where-people-want-to-live.pdf
[14] New Zealand Government. (2012). Budget 2012: Recovery of Canterbury on track. Beehive.govt.nz. Retrieved from https://www.beehive.govt.nz/release/budget-2012-recovery-canterbury-track
[15] New Zealand Government. (2013). Housing accords legislation passes first reading. Beehive.govt.nz. Retrieved from https://www.beehive.govt.nz/release/housing-accords-legislation-passes-first-reading
[16] Greater Auckland. (2013, September 30). Unitary plan notified. Greater Auckland. Retrieved from https://www.greaterauckland.org.nz/2013/09/30/unitary-plan-notified
[17] Auckland Council. (2016). IHP designations, reports, recommendations. Auckland Council. Retrieved from https://www.aucklandcouncil.govt.nz/plans-projects-policies-reports-bylaws/our-plans-strategies/unitary-plan/history-unitary-plan/ihp-designations-reports-recommendations/Documents/ihpoverviewofrecommendations.pdf
[18] West, E. (2024). Up-zoning New Zealand: The localisation of a globally mobile policy idea. Economic Policy Centre, University of Auckland. Retrieved from https://www.auckland.ac.nz/assets/business/our-research/docs/economic-policy-centre/urban-and-spatial-economics/up-zoning-new-zealand-the-localisation-of-a-globally-mobile-policy-idea.pdf
[19] New Zealand Productivity Commission. (2015). Using land for housing: Final report. Retrieved from https://www.treasury.govt.nz/sites/default/files/2024-05/pc-inq-ulh-using-land-for-housing-final-report-v2.pdf
[20] New Zealand Government. (2016). Govt responds to land supply inquiry1. Beehive.govt.nz. Retrieved from https://www.beehive.govt.nz/release/govt-responds-land-supply-inquiry
[21] New Zealand Government. (2016). Building consents top 28,000. Beehive.govt.nz. Retrieved from https://www.beehive.govt.nz/release/building-consents-top-28000
[22] See, e.g., New Zealand Treasury (2024) (Retrieved from https://www.treasury.govt.nz/sites/default/files/2024-05/pc-inq-ulh-government-response-detailed.pdf) and Ministry for the Environment (2016). (Retrieved from https://environment.govt.nz/publications/national-policy-statement-on-urban-development-capacity-2016/).
[23] Interest.co.nz. (2024). PM says no housing crisis: Auckland says govt getting on top of it despite MBIE analysis. Interest.co.nz. Retrieved from https://www.interest.co.nz/property/74601/pm-says-no-housing-crisis-auckland-says-govt-getting-top-it-despite-mbie-analysis
[24] Radio New Zealand. (2024). Key denies AKL housing crisis. Retrieved from https://www.rnz.co.nz/news/political/271023/key-denies-akl-housing-crisis
[25] OECD. (2024). New Zealand. OECD Better Life Index. Retrieved from https://www.oecdbetterlifeindex.org/countries/new-zealand/
[26] Interest.co.nz. (2024). Poverty gap between rich, poor and housing affordability, housing shortage and…. Interest.co.nz. Retrieved from https://www.interest.co.nz/news/89038/poverty-gap-between-rich-poor-and-housing-affordability-housing-shortage-and
[27] Newshub. (2016). Labour’s Kiwibuild popular with voters. Retrieved from https://www.newshub.co.nz/home/politics/2016/08/labours-kiwibuild-popular-with-voters.html
[28] Stuff. (2019). Phil Twyford says only 3000 KiwiBuild homes are due to be finished by July. Retrieved from https://www.stuff.co.nz/national/politics/110113848/phil-twyford-says-only-3000-kiwibuild-homes-are-due-to-be-finished-by-july
[29] New Zealand Government. (2019). Families package helps over 1 million New Zealanders in first year. Retrieved from https://www.beehive.govt.nz/release/families-package-helps-over-1-million-new-zealanders-first-year
[30] New Zealand Government. (2018). New housing and urban development ministry. Retrieved from https://www.beehive.govt.nz/release/new-housing-and-urban-development-ministry
[31] New Zealand Government. (2018). Record building consents show strong progress. Retrieved from https://www.beehive.govt.nz/release/record-building-consents-show-strong-progress
[32] New Zealand Government. (2019). Wages rising faster than house price rises. Beehive.govt.nz. Retrieved from https://www.beehive.govt.nz/release/wages-rising-faster-house-price-rises
[33] Ministry for the Environment. (2022). National Policy Statement on Urban Development. Retrieved from https://environment.govt.nz/acts-and-regulations/national-policy-statements/national-policy-statement-urban-development/#what-it-does
[34] New Zealand Government. (2024). Factsheet 3 – Council processes. Retrieved from https://www.beehive.govt.nz/sites/default/files/2024-07/Factsheet%25203%2520-%2520Council%2520processes.pdf
[35] See, for example, MacManus. (2024). A rare moment of unity: MPs hate Wellington’s new housing report. The Spinoff. Retrieved from https://thespinoff.co.nz/politics/09-02-2024/a-rare-moment-of-unity-mps-hate-wellingtons-new-housing-report. Readers are referred to West (2024) for a more detailed discussion of the political context to these policies.
[36] O’Sullivan, M. (2024). More train station housing on the table as Labor says it’s not done with planning changes. The Sydney Morning Herald. Retrieved from https://www.smh.com.au/national/nsw/more-train-station-housing-on-the-table-as-labor-says-it-s-not-done-with-planning-changes-20240910-p5k9cy.html
[37] New Zealand Government. (2024). Going for Housing Growth stage one unveiled. Beehive.govt.nz. Retrieved from https://www.beehive.govt.nz/release/going-housing-growth-stage-one-unveiled#:~:text=The%2520Government%2520will
[38] Where policy reforms have the effect of increasing the elasticity, or price responsiveness, of housing supply, then we expect to observe larger changes in quantities (and smaller changes in prices) in response to demand shocks, such as higher interest rates. In this context, the relatively large fall in numbers of building consents in New Zealand since 2022 is not entirely unexpected.
[39] Ministry of Business, Innovation and Employment. (2023). Building and construction sector trends: Annual report 2023. Retrieved from https://www.mbie.govt.nz/assets/building-and-construction-sector-trends-annual-report-2023.pdf
[40] For details on the economic appraisal of the NPS-UD and MDRS see PwC. (2020). Cost-benefit analysis for a National Policy Statement on Urban Development. Retrieved from https://environment.govt.nz/assets/Publications/Files/NPS-UD-CBA-final.pdf and PwC. (2022). Cost-benefit analysis of proposed Medium Density Residential Standards. Retrieved from https://environment.govt.nz/assets/publications/Cost-benefit-analysis-of-proposed-MDRS-Jan-22.pdf
[41] We exclude the experience of Christchurch and Canterbury simply because it followed an earthquake and has not been the subject of detailed academic research.
[42] Greenaway-McGrevy, R. (2024). Causes and consequences of Zoning Reform in Auckland. Cityscape, 26(2), 413-434.
[43] Greenaway-McGrevy, R., & Jones, J. A. (2023). Can zoning reform change urban development patterns? Evidence from Auckland. Economic Policy Centre, 2(5), 13.
[44] For details, see Maltman, M., & Greenaway-McGrevy, R. (2024). Going it Alone: The Impact of Upzoning on Housing Construction in Lower Hutt. Retrieved from https://www.sciencedirect.com/science/article/pii/S1051137724000512
[45] The advantage of indexing to 2001 is that it highlights relative trends in dwelling and population growth in this period between locations and over time. The disadvantage of indexing is that it serves to remove differences between locations that existed in 2001.
[46] For evidence on the positive effects of cities on learning and productivity, see Roca, J. D. L., & Puga, D. (2017). Learning by working in big cities. The Review of Economic Studies, 84(1), 106-142.
[47] Chen, Y., & Rosenthal, S. S. (2008). Local amenities and life-cycle migration: Do people move for jobs or fun?. Journal of Urban Economics, 64(3), 519-537.
[48] OECD. (2024). New Zealand. OECD Better Life Index. Retrieved October 23, 2024, from https://www.oecdbetterlifeindex.org/countries/new-zealand/
[49] OECD. (2024). Australia. OECD Better Life Index. Retrieved October 23, 2024, from https://www.oecdbetterlifeindex.org/countries/australia/
[50] For data on Australia and New Zealand, respectively, see CoreLogic. (2024). Australian home values surge in 2023. CoreLogic Australia. Retrieved October 23, 2024, from https://www.corelogic.com.au/news-research/news/2024/australian-home-values-surge-in-2023 and CoreLogic. (2024). Property market signs off 2023 on a strong note. CoreLogic New Zealand. Retrieved October 23, 2024, from https://www.corelogic.co.nz/news-research/news/2024/property-market-signs-off-2023-on-a-strong-note
[51] Brunskill, Dan. (2024). Interest.co.nz. Housing too expensive and average prices need to fall even if it scares existing homeowners. Interest.co.nz. Retrieved October 23, 2024, from https://www.interest.co.nz/property/128300/housing-too-expensive-and-average-prices-need-fall-even-if-it-scares-existing
[52] I thank an anonymous referee for this observation.