Energy market bodies’ blind faith in solar paradise
Rooftop solar uptake depends on high financial returns
Federal government rebates made rooftop solar more affordable
State governments implemented generous feed-in tariffs to accelerate adoption
Measuring the return on investment for rooftop solar in New South Wales
Financial returns drive rooftop solar adoption in New South Wales
How much does rooftop solar save the grid?
Rooftop solar and the distribution network
Rooftop solar does not save distribution costs through demand reduction
Rooftop solar increases distribution costs by introducing instability
Rooftop solar owners are earning outsized bill savings
Rooftop solar owners are being cross-subsidised by non-solar customers
Current tariff structures enable cross-subsidies at the expense of consumers without rooftop solar
Rooftop solar: reverse Robin Hood
Export charges will not end cross-subsidies
Two-way export tariffs introduced, but not everywhere
Rooftop solar owners continue to earn outsized savings under two-way export tariffs
Batteries will not lead us to paradise
State government battery subsidies have largely failed to increase uptake
Batteries are unlikely to save distribution costs
Ending the cross-subsidies: difficult but necessary
Large fixed component and small variable critical peak charge
Large fixed component and small variable critical peak charge with SMS
Fixed charge only based on land or property value
Fixed charge only based on household income
Fixed charge only with limited or unlimited peak demand options
Fixed charge based on residence size and type and household size
Payback period, 25-year ROI, and 25-year IRR for rooftop solar
System savings from rooftop solar
Outsized savings for NEM customers under current tariffs
Outsized savings for Ausgrid customers with and without export tariffs.
Executive Summary
Rooftop solar has been lauded by energy market bodies, policymakers, the media and environmental groups as a great way to lower bills, help the environment and help the grid. But while rooftop solar may have lowered bills for homeowners able to install it, it has done so by increasing bills for everyone else. As more consumers respond to distorted price signals by installing rooftop solar, the paradise that has been promised is being lost.
Over the past 15 years, rooftop solar has enjoyed rapid growth in Australia due to its historically high return on investment for households. In 2011, government rebates covered more than 75% of installation costs for a 1.5 kW system, coinciding with the highest installation rate to date. Although direct government subsidies have declined in recent years, rooftop solar systems still offer households substantial financial benefits. In New South Wales (NSW), this amounts to a return on investment of well over 200% and a payback period of less than 6.5 years. However, these financial returns do not reflect the value that rooftop solar provides the grid.
CIS analysis suggests rooftop solar generation saves the electricity grid at most only 4c/kWh in averted variable operating and fuel costs for coal and gas plants. This is before including any additional network upgrade costs that arise when the grid is stressed by a glut of rooftop solar output in the middle of the day; so actual system savings may be much lower.
Using conservative assumptions, the CIS estimates rooftop solar owners in National Electricity Market (NEM) states are currently receiving bill savings of 8–18c/kWh for their solar generation, including both exports and self-consumption. This means rooftop solar owners are receiving savings 2–4.5 times higher than the value their solar generation is providing the grid.
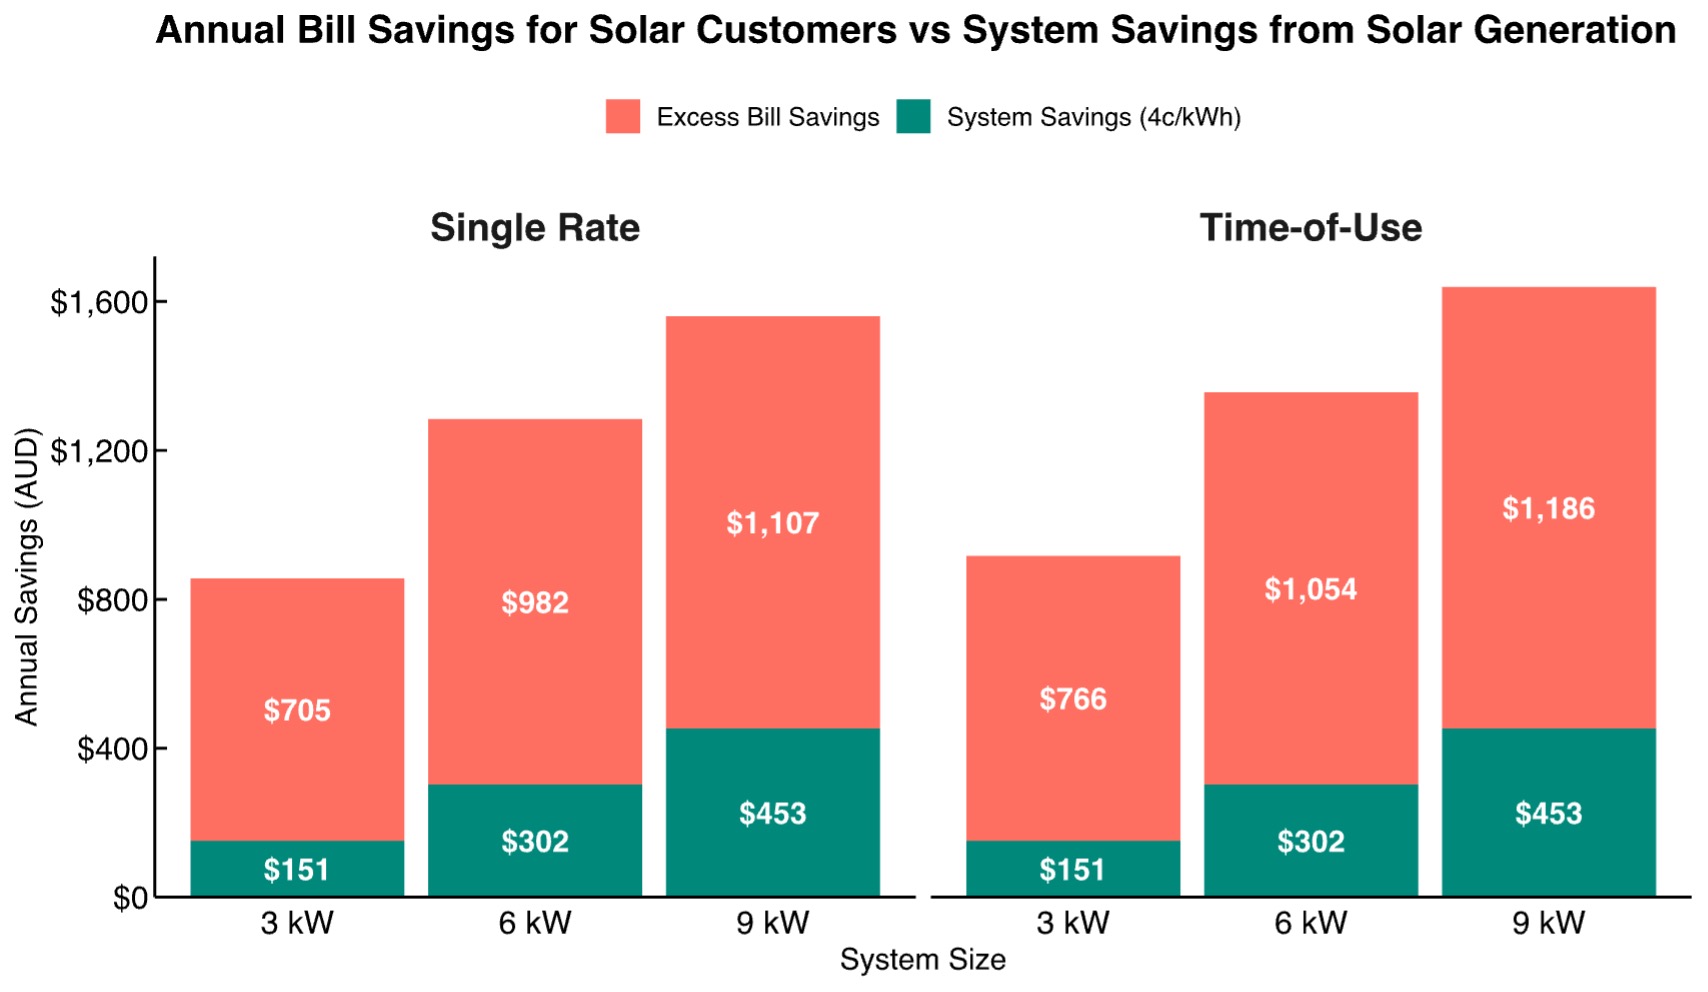
In the Ausgrid network in NSW, solar customers are earning, on average, $705 to $1,186 more than the cost savings their generation provides the grid (Figure 1). These outsized savings have arisen because solar customers are paying much less than non-solar customers for their use of the network, despite imposing similar or even higher costs on the network. Distribution Network Service Providers (DNSPs) must recoup this lost revenue by charging other customers more, which creates substantial cross-subsidies from those who do not own rooftop solar to those who do. Rooftop solar owners tend to be older and wealthy enough to own a house, meaning those who are less wealthy — particularly young renters and apartment dwellers — are effectively paying part of their energy bills. This ‘reverse Robin Hood’ — taking from the poor to give to the rich — is increasing bill stress for the most vulnerable consumers.
To listen to this research on the go, subscribe on your favourite platform: Apple, Spotify, Amazon, iHeartRadio or PlayerFM.
Figure 1. Bill savings for Ausgrid rooftop solar customers on both single rate and time-of-use tariffs exceed electricity system savings from rooftop solar generation (4c/kWh) regardless of solar system size
The outsized savings rooftop solar owners receive arise because of the way network costs are passed onto consumers. DNSPs recoup 60-75% of their mostly fixed costs through variable network charges or ‘tariffs’, which retailers typically pass on to consumers as a component of variable usage rates. But rooftop solar owners are often able to avoid paying these usage rates — and the network charges they contain — through self-consuming their solar output during the day.
Rooftop solar owners also benefit from rewards for their exports. Some DNSPs in NSW have introduced new two-way export tariffs that charge for exports during peak solar hours, which would help to reduce the earnings customers receive from exporting to the grid if passed through by retailers. Nevertheless, most retailers currently provide rewards well above 4c/kWh for exports, adding to the outsized savings rooftop solar owners receive from averted usage. Even if retailers do pass through two-way export tariffs to customers, NSW solar customers will continue to receive substantial outsized savings of $538 to $617 more than they should be, mostly through continuing to avoid variable usage rates by self-consuming solar output.
Recent attempts by the energy market bodies to make network tariffs more cost-reflective have fallen short, as they have involved moving customers to time-of-use or demand tariffs. These tariff structures do not send consumers a price signal based on the main driver of network upgrade costs: forecast critical peak demand, or the highest level of demand in a year or several years. While demand tariffs can reduce cross-subsidies, they are too blunt an instrument to eliminate them. Time-of-use tariffs are much less cost-reflective than demand tariffs. CIS analysis indicates Ausgrid solar customers on time-of-use tariffs earn even greater savings than single-rate solar customers (Figure 1). This suggests the current reform efforts to put single-rate customers on time-of-use tariffs may make cross-subsidies worse in the short term, at least in some distribution networks.
Rooftop solar is unable to provide material savings on distribution network upgrade costs, as these are driven by forecast critical peak demand. DNSPs have quantified apparent reductions in historical critical peak demand from rooftop solar output, but these are not on the spatial or temporal timescales necessary to reduce the need for local grid upgrades. Rooftop solar cannot provide savings from demand reduction, as such reductions are not reliable enough to base forecasts on. Any DNSP that assumes a given level of rooftop solar output during a critical peak demand event risks this not eventuating due to cloud cover, and therefore saves upgrade costs at the expense of increasing the risk of reliability breaches — a false economy. In fact, increasing penetrations of rooftop solar will likely increase the need for upgrades. DNSPs would have to incur currently unknown, but likely substantial, costs to manage the effects of grid stress from minimum demand and a glut of solar exports in the middle of the day. Yet, even without considering these added costs, rooftop solar owners are still being subsidised by those without rooftop solar.
Serious network tariff reform is required to eliminate cross-subsidies for rooftop solar. The most effective way to do this may be to switch to a network tariff structure with a fixed charge based on residence type, with no variable charges. Customers would still face variable charges for the generation component of their bill based on their usage, but network charges would be entirely recovered through the fixed daily charge. This would prevent solar customers from receiving outsized savings from self-consumption. Although it would not be as cost-reflective as charging customers for their contribution to critical peak demand, it may be more feasible to implement. Crucially, a fixed charge would not punish consumers with inflexible energy needs, such as young families, for being unable to reduce their critical peak demand. It would also alleviate bill stress for those without solar by ending solar cross-subsidies.
If cross-subsidies were eliminated, rooftop solar installations would likely plummet, as the vast majority of consumers who invest in rooftop solar do so because it benefits them financially. If rooftop solar’s true value to the system were reflected in the bill savings of rooftop solar owners, very few would install new systems or replace existing ones. Given the Australian Energy Market Operator’s (AEMO) Integrated System Plan (ISP) relies on a four-fold increase in rooftop solar by 2050, the question remains as to how this will be achieved without cross-subsidies continuing. This magnitude of increase in rooftop solar installations would mean a shrinking base of non-solar customers would have to subsidise the network costs of a growing cohort of rooftop solar owners. With worsening bill impacts for vulnerable consumers, governments would likely have to step in with greater direct subsidies to ensure the incentives to install rooftop solar continue, further burdening the taxpayer and stoking inflation.
The analysis in this paper mainly concerns rooftop solar owners who do not own batteries. Home batteries are often put forward as the solution to the problems caused by increasingly high penetrations of rooftop solar because they can shift solar generation to periods of peak demand and help reduce stress on the grid. But batteries remain uneconomic for most rooftop solar owners and state government subsidies have thus far failed to provide enough incentive to substantially increase uptake. With battery prices remaining flat for the past six years, there is no guarantee prices will halve in the near future, as commonly assumed. Given home batteries are more than twice the price of grid-scale batteries, incentivising their uptake represents a suboptimal policy that will increase overall system costs, which is reflected in consumer bills. Subsidising home batteries as a solution to our grid’s rooftop solar woes is simply throwing good money after bad.
Rooftop solar provides little value to the grid. It was never going to lead Australia to an energy paradise. Hence, we should end the cross-subsidies driving rooftop solar uptake and the inevitable bill stress it causes, particularly for the most vulnerable consumers.
1. Introduction
For years, Australians have been promised an energy paradise powered by rooftop solar. As Energy Minister Chris Bowen puts it:
When it comes to powering our homes, Australians know nothing will beat our sun. We are lucky to call the sunniest continent on earth home, which means we’ve got access to the cheapest and cleanest renewable energy resource at our fingertips. Aussie homeowners know rooftop solar is a no-brainer when it comes to bringing down bills, which is why we have been installing about 300,000 rooftop systems a year and there is no sign of that slowing down.[1]
Prime Minister Anthony Albanese has similarly painted a rosy picture:
High-efficiency rooftop solar is absolutely central to reducing our national emissions, rebuilding our national energy grid and taking pressure off family budgets… It’s a way of doing the right thing by the environment, while cutting your power bill…Rooftop solar reduces household bills by up to 57 per cent… This also takes pressure off the national grid, when rooftop solar output goes up, wholesale demand — and wholesale prices — go down. This is where your hard work serves Australia’s national interest.[2]
This vision of a sun-drenched nation powered by an ever-growing sea of solar panels may seem like a dream come true. However, recent events have revealed serious flaws in this narrative of solar-powered prosperity.
Rooftop solar was of little help when NSW faced peak electricity demand during a sub-40°C heatwave just before summer 2024.[3] The only way the state avoided blackouts was by asking — sometimes even paying — residents and businesses to reduce their electricity use in the evening.[4] More recently, the Australian Energy Market Operator (AEMO) requested that emergency powers switch off rooftop solar systems. This suggests that, rather than being a benefit to the grid, the rapid expansion of rooftop solar is posing a threat to the grid’s stability and security.[5]
Yet, politicians and policymakers continue to promote rooftop solar as an economic and environmental win-win. The Prime Minister has gone so far as to claim that just as rooftop solar “makes economic sense” for individual households, large-scale solar “makes sense” for the national economy.[6] Albanese has tied Labor’s 82% renewables target for 2030 to lower energy bills, implying that because rooftop solar reduces costs for some households, expanding renewables will lower electricity prices overall.
But this raises a fundamental question: Is rooftop solar truly lowering energy costs for everyone, or simply shifting the burden onto those without it?
This paper examines how rooftop solar, rather than delivering the universal economic and environmental benefits often promised, has created financial distortions in Australia’s energy market. These distortions have led to inequitable cost-shifting, where non-solar households bear the financial burden of subsidising solar owners. While rooftop solar customers enjoy significant savings, the wider electricity system is grappling with rising costs and grid instability.
To understand this dynamic, the paper first explores how government incentives and tariff structures have fuelled rooftop solar adoption, creating substantial financial returns for solar owners while increasing costs for non-solar consumers. It then examines the impact of rooftop solar on the electricity grid, revealing that while it reduces daytime demand, it does not alleviate peak stress and may, in fact, exacerbate system instability. Finally, the paper assesses proposed reforms, such as two-way export tariffs and battery adoption, and whether they can address the inequities and technical challenges created by widespread rooftop solar.
Despite the prevailing belief that rooftop solar benefits all consumers, energy market bodies and policymakers have failed to provide clear evidence it reduces total system costs. Instead, as this analysis will demonstrate, the vision of a solar-powered paradise may be more illusion than reality.
2. Energy market bodies’ blind faith in solar paradise
Australia’s energy market bodies have lauded rooftop solar and home batteries as key components in achieving emissions reduction goals. They argue that greater consumer participation in energy generation will not only reduce emissions but also lower total system costs and enhance grid stability. However, the claim that increased penetration of rooftop solar and home batteries will lower total system costs has not been rigorously tested or backed by comprehensive modelling. This is concerning, as pursuing a suboptimal emissions reduction strategy that increases system costs unnecessarily could lead to higher electricity bills, ultimately jeopardising public support for decarbonisation.
In December 2023, the energy ministers revised the National Electricity Objective (NEO) to incorporate emissions reduction, alongside price, reliability, and security of electricity supply, as a key consideration for energy regulators. However, while emissions reduction is now formally part of the NEO, it is intended to be considered alongside — not prioritised above — other objectives; including affordability and reliability.[7]
Despite this balanced mandate, AEMO, the Australian Energy Regulator (AER), and Australian Energy Market Commission (AEMC) frequently prioritise rooftop solar and battery adoption on the belief that it reduces both emissions and electricity costs. However, this is not supported by comprehensive evidence or rigorous cost-benefit modelling.
AEMO has, for example, estimated $4.1 billion in savings specifically from coordinating home batteries compared to uncoordinated storage.[8] However, it has not assessed whether encouraging widespread rooftop solar and home battery uptake itself delivers lower total system costs relative to, for instance, investing more heavily in utility-scale renewables.[9] Uptake and coordination are two separate issues: just because efficiency gains can be made by coordinating consumer energy resources (CER), it does not follow that widespread adoption of CER is cost-effective or beneficial for the overall energy system.
Nevertheless, AEMO’s ISP — the federal government’s energy transition blueprint — relies on a four-fold increase in rooftop solar and 34-fold increase in home batteries by 2050 to offset a significant amount of large-scale utility generation and storage needed by the grid.[10] Given the significant shift of generation responsibility onto households, one would reasonably expect AEMO to conduct a thorough cost-benefit analysis to demonstrate the net benefits to consumers of such an approach. Instead, the ISP treats CER uptake as an exogenous fixed assumption rather than an endogenous variable optimised alongside utility-scale investments. This approach forces utility-scale investments to be planned around an optimistic and uncosted CER forecast; inherently constraining the exploration of lower-cost scenarios where consumer energy investments play a smaller role.
Recent statements made by AEMO’s CEO Daniel Westerman to a Senate inquiry illustrate AEMO’s belief in Australia’s solar-driven future:
Let me first acknowledge the absolutely critical and important role that consumers play in Australia’s energy transition. Australia has one of the highest adoption rates of rooftop solar in the world. It is a very important part of our energy system both today and into the future. As consumers continue to invest in their own resources, both rooftop solar and batteries, electric vehicles and other smart appliances, that’s right; the Integrated System Plan did find in its analysis that if those resources are able to participate in the broader market, the whole system will cost $4.1 billion less for consumers. We say it’s important to find ways for consumers and their devices to participate in the broader system because that results in lower costs for everyone, not just for those who can afford those devices.[11]
Yet Westerman’s statement relies entirely on a narrowly-scoped analysis of battery coordination, without comparing CER uptake itself against large-scale investment alternatives.[12] Thus, Australia’s current energy blueprint, which expects consumers to shoulder substantial financial burdens, relies on unproven assumptions rather than robust evidence.
Critically, consumers who invest in rooftop solar and batteries expect financial returns (see Section 3), adding to the total cost of the energy system. By forcing significant rooftop solar and home battery installations into the current renewable energy masterplan — which crowds out utility-scale projects — energy market bodies cannot ensure the energy transition delivers the lowest-cost system for consumers. This approach not only falls short of the NEO’s mandate to balance affordability alongside emissions reduction but also jeopardises reliability if optimistic CER projections fail to materialise. Should rooftop solar and battery adoption lag behind AEMO’s forecasts, additional utility-scale infrastructure — including more fossil fuel generation — would need to be developed reactively rather than through forward planning; leading to a suboptimal outcome that raises both costs and emissions.
The AER has also similarly stated in a recent report that “consumer investments in CER can help to lower costs for all electricity consumers” and citing AEMO’s $4.1 billion of battery coordination savings figure to back up their claim.[13] The AER’s CER strategy, launched in 2023, explicitly aims to “support consumers to own energy resources and use those resources to consume, store and trade energy as they choose”.[14] The AER has cited AEMO to support its strategic goals, using an even larger, albeit unreferenced figure: “AEMO’s ISP notes that successful integration of CER will offset up to $11 billion in network augmentation costs”.[15] Yet, the AER has not demonstrated that increasing CER investments will be the most cost-effective way to transition the grid.
The AEMC has echoed these sentiments, reiterating that “CER offers substantial benefits for consumers”.[16] In a recent speech, AEMC Chair Anna Collyer emphasised “you know how important it is to us that the role of consumer energy resources, or CER, is recognised and supported”.[17] Like the AER, the AEMC cites AEMO’s flawed modelling, focused solely on the coordination of CER, to imply greater uptake will lower consumer bills. As the AEMC stated in its submission to the Senate inquiry:
Effective integration and coordination of CER could deliver net benefits estimated at between $1 billion and $6.3 billion from 2030-2040. These benefits ultimately flow back as lower energy bills to all consumers, including those who do not have direct access to the technology. The stronger CER is in our system, the more confident we can be about overall power supply and the less back-up infrastructure we need to build at utility-scale. AEMO’s 2024 Integrated System Plan suggests that coordinated CER can avoid $4.1 billion in additional grid-scale investment, directly impacting consumer bills.[18]
Notably absent from the AEMC’s statements are any consideration of whether rooftop solar and home batteries might increase total system costs — and, by extension, household electricity bills. Instead, the AEMC has placed CER reform among its top five priorities, with a stated focus on “consumers’ freedom to choose how their energy resources are used and how market arrangements should enable CER to improve the efficiency of the system to benefit all”.[19] The assumption that rooftop solar and home batteries can benefit all consumers remains unchallenged by the energy regulator or the market commission.
The energy market bodies’ belief in the rooftop solar paradise is deeply concerning. The AER and AEMC’s fundamental responsibility is to safeguard the long-term interests of consumers, yet they have shown little interest in determining the costs and benefits of the mass uptake of CER they actively promote. Instead of independent scrutiny, all energy bodies refer to AEMO’s flawed modelling; which assumes — rather than proves — that widespread CER adoption will lower system costs. As this paper will show, the benefits of rooftop solar have been greatly oversold, while its true cost to consumers — hidden within their energy bills — has begun to surface.
3. Rooftop solar uptake depends on high financial returns
While early adopters of rooftop solar may have been motivated by environmental concerns or curiosity about emerging technology, it is the promise of substantial financial savings that has driven the majority of households to embrace solar power.
Empirical studies consistently show that economic incentives are the strongest motivators for rooftop solar uptake. A CSIRO study, for example, found 75% of rooftop solar owners cited financial reasons for their decision, compared to only 53% motivated by environmental factors.[20] Similarly, a Newgate Research report for Energy Consumers Australia revealed the top motivations for installing solar were reducing or eliminating electricity bills and saving money through self-consumption of solar power.[21] Another survey by Ausgrid corroborated these findings, with 91% of respondents stating that saving on energy bills was very or extremely important in their decision to install solar panels.[22]
In short, most households are unlikely to install rooftop solar unless they perceive it as a significant financial benefit. Federal and state governments have offered various subsidies to incentivise rooftop solar uptake, particularly during periods when the technology was expensive and less accessible. These incentives, including upfront rebates and generous feed-in tariff schemes, have provided compelling financial benefits to rooftop solar owners, on top of the savings from using their solar energy directly to power their homes.
3.1 Federal government rebates made rooftop solar more affordable
Australia’s federal subsidies and rebates for rooftop solar have undergone various changes since the introduction of the Photovoltaic Rebate Program (PVRP) in 2000 (Table 1). Initially, the PVRP provided rebates of $5.50 per watt for systems of at least 450 W, capped at $8,250 per household. Over time, challenges like oversubscription and budget constraints led to adjustments in rebate rates and household caps. By 2003, the rebate was reduced to $4/W, with a maximum of $4,000 per household. However, in 2007, as the federal election approached, the Coalition government, facing political pressure to close the policy gap with the Labor opposition on climate change, increased the rebate to $8/W, with a cap of $8,000 per household. After coming into power, the Labor government rebranded the program as the Solar Homes and Communities Plan (SHCP). The revised PVRP-SHCP program significantly altered the financial calculus for rooftop solar, [23] covering up to 45% of installation cost for a 1.5kW solar system.
Table 1. Federal rooftop solar rebates over time
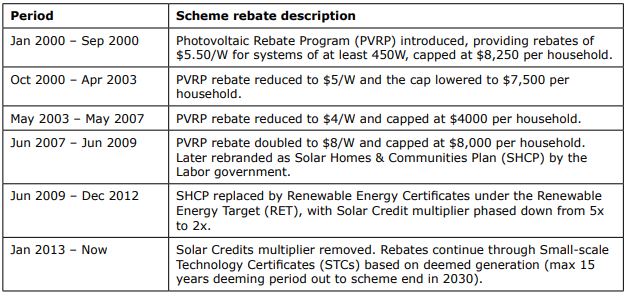
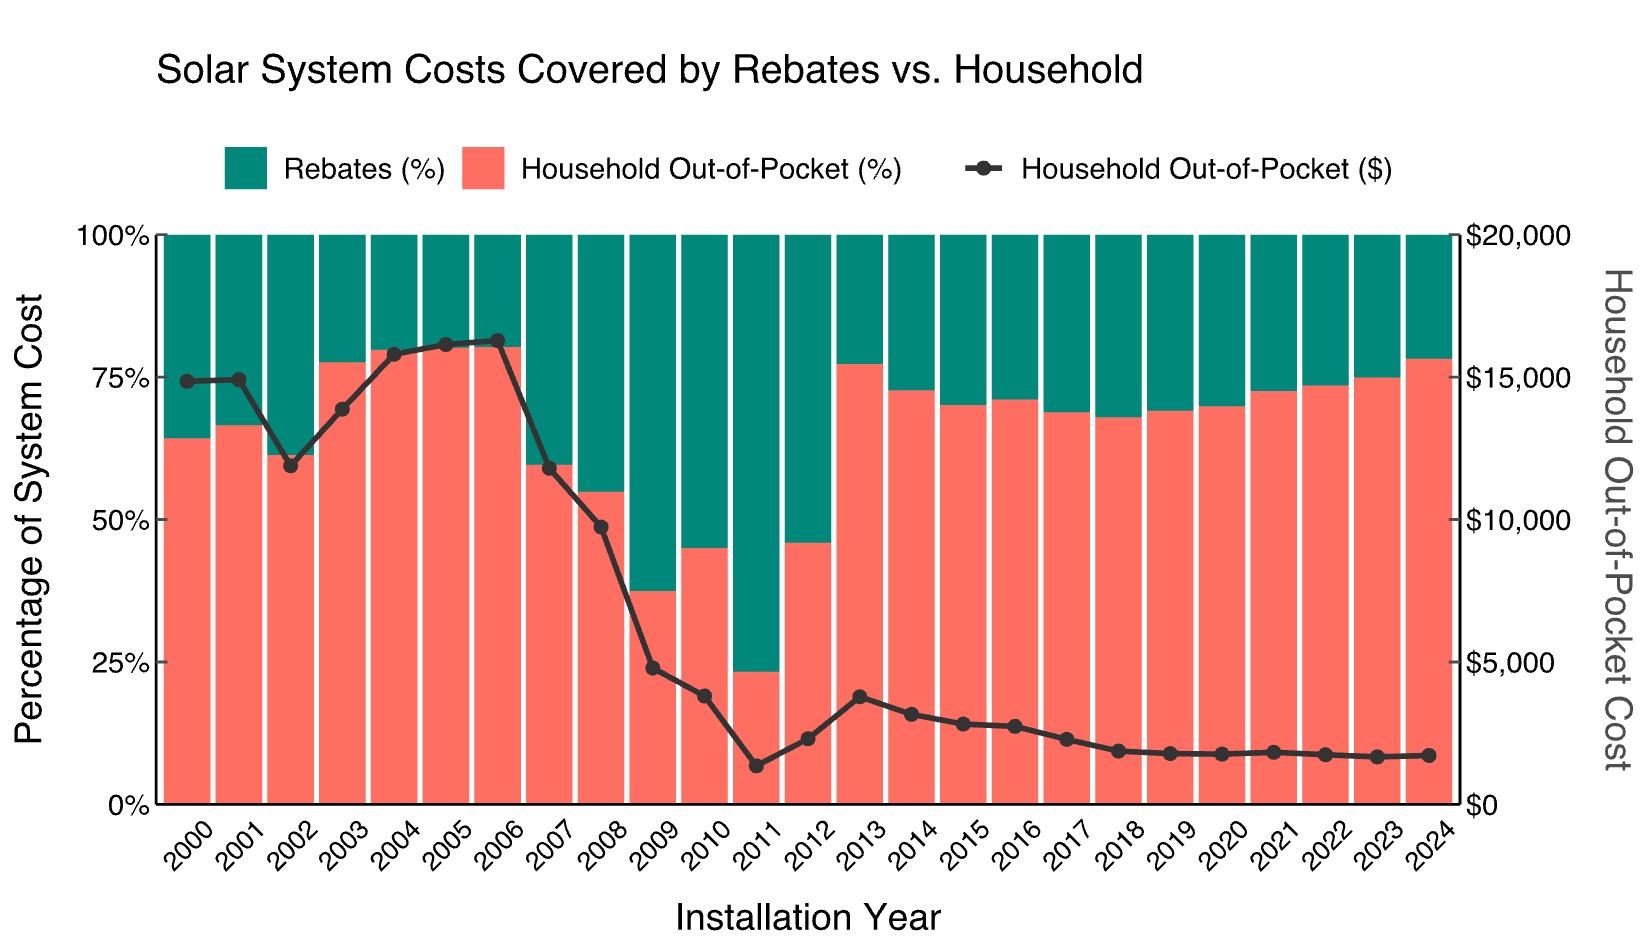
From 2009 to 2012, government rebates as a percentage of costs for a 1.5 kW system reached their highest (Figure 2). On 9 June 2009, the PVRP-SHCP scheme was abruptly replaced by the Solar Credits Program under the Renewable Energy Target (RET) reforms. The program introduced a multiplier for Renewable Energy Certificates (RECs), which are tradable certificates representing one megawatt-hour (MWh) of electricity generated from renewable sources. In 2011, RECs were split into large-scale and small-scale certificates, with rooftop solar systems eligible for small-scale technology certificates (STCs). Electricity retailers and other liable entities were mandated to purchase and surrender a specific number of certificates annually to comply with their renewable energy obligations under the RET, creating an indirect subsidy for renewable energy providers.
Initially, the Solar Credits Program applied a 5x multiplier to the number of certificates created for the first 1.5 kW of a system’s capacity; providing substantial upfront savings for solar installations. The multiplier was gradually reduced to 3x in mid-2011, 2x in mid-2012, and finally phased out by January 2013.[24] After this, rebates continued through STCs, with certificates calculated based on the system’s deemed electricity generation — the amount the system is expected to generate — over a maximum period of 15 years. This deeming period decreases annually as the RET approaches its end in 2030.
Figure 2. Proportion of 1.5 kW solar system costs covered by government rebates vs. household (2000–2024)
3.2 State governments implemented generous feed-in tariffs to accelerate adoption
In addition to federal rebates, state and territory governments introduced feed-in tariff schemes to further incentivise rooftop solar adoption. These schemes provided payments for electricity generated by solar systems, either as government subsidies or by mandating retailers to pay specific rates.
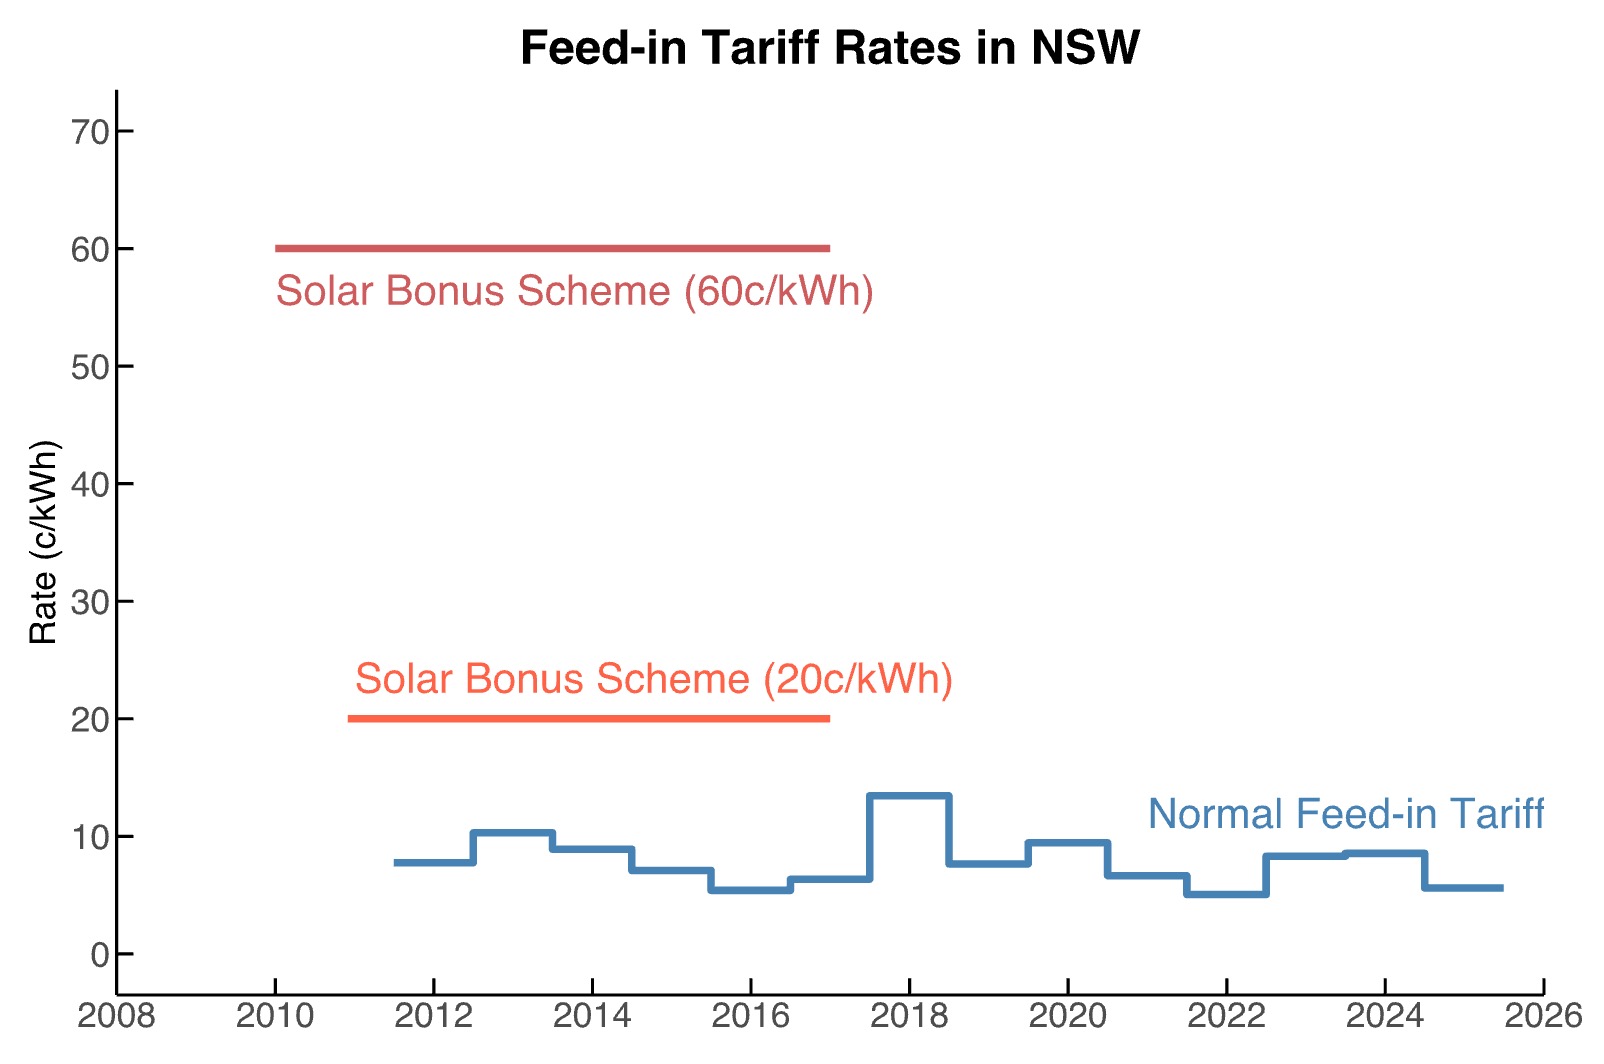
For instance, the NSW government’s Solar Bonus Scheme, launched in January 2010, offered a gross feed-in tariff of 60 cents per kilowatt-hour (kWh), compensating solar households for all electricity generated including self-consumption. This generous scheme quickly became oversubscribed, leading the government to reduce the rate for new participants to 20 cents/kWh in December 2010 and closed the program to new applicants in April 2011. Households that applied to join the Scheme by 28 April 2011 were allowed to complete their connection by 30 June 2012 to receive Scheme payments.[25] Eligible participants continued to receive the gross feed-in tariff until the last Scheme payment was made on 31 December 2016. Other states implemented similar programs, albeit with varying rates and structures, contributing to significant solar uptake nationwide.
As shown in Figure 3, the Solar Bonus Scheme’s 60c/kWh and 20c/kWh tariffs were around two to six times higher than the average retailer feed-in tariffs.[26] The premium tariffs were available to applicants that installed solar systems before the end of November 2010 (for the 60c/kWh rate) or June 2011 (for the 20c/kWh rate) and remained in effect until the Scheme concluded on 31 December 2016. The Scheme greatly improved the return on investment for households during this period.
Figure 3. Feed-in tariff rates in New South Wales (2010–2025)
3.3 Measuring the return on investment for rooftop solar in New South Wales
To illustrate the relationship between financial returns and the uptake of rooftop solar, an analysis was conducted to estimate the lifetime bill savings and payback period for the average solar household in NSW. The analysis considers how evolving factors—such as system costs, government incentives, feed-in tariffs, and average system size—have influenced the financial payback of rooftop solar over time.
Households have two ways of saving on electricity costs through rooftop solar:
- Export savings are earned through feed-in tariffs for a household’s surplus solar energy. The NSW government’s Solar Bonus Scheme initially offered premium feed-in tariffs to encourage adoption. After the scheme ended, retailers continued to provide feed-in tariffs, with rates monitored and benchmarked by the Independent Pricing and Regulatory Tribunal (IPART).
- Self-consumption savings represent the avoided cost of purchasing electricity from the grid by a household using its own solar energy. With retail electricity rates often 3-4 times higher than feed-in tariff rates post-Scheme, self-consumption has become the primary financial driver for solar households. As electricity prices continue to rise, self-consumption savings have grown, making rooftop solar increasingly attractive.
In this analysis, the financial returns for rooftop solar installations are calculated for systems installed each month from January 2000 to November 2024. The upfront installation cost (adjusted for government rebates available at the time) is calculated alongside monthly bill savings. Three key metrics are used to track the financial returns of rooftop solar:
- Payback period measures the time it takes for cumulative bill savings to equal or exceed the net installation cost. It is a practical indicator of how quickly households can recover their initial investment and is a widely used metric, often featured in popular online calculators. For installations that do not break even within the analysis period (to November 2024), the remaining time to reach the break-even point is estimated by dividing the residual cost by the latest monthly savings. This approach aligns with industry findings that households generally base investment decisions on current electricity prices with only short-term adjustments, rather than relying on long-term price forecasts.[27]
- 25-year net return on investment (ROI) shows how much money households save (or lose) over 25 years compared to the upfront installation cost. The ROI is calculated by subtracting the installation cost (net of government rebates) from the total bill savings, then dividing the net savings by the installation cost. For installations where the 25-year period extends beyond the analysis timeframe (to November 2024), the ROI is estimated by projecting the latest month’s bill savings forward until the full 25 years is reached.
- 25-year internal rate of return (IRR) represents the annualised rate of return that equates the present value of a rooftop solar system’s expected lifetime bill savings to the upfront installation cost. A higher IRR indicates a more attractive financial return, while a negative IRR suggests that the investment does not recover its initial cost within the assumed timeframe.
For a detailed discussion of the inputs, assumptions, and methodology used in this analysis, please refer to Section 11.1 in the Appendix.
3.4 Financial returns drive rooftop solar adoption in New South Wales
The results reveal a strong correlation between financial returns and the uptake of rooftop solar in NSW (see Figure 4). Before 2008, installing rooftop solar was not a good financial investment for most households. While the government provided significant rebates, the upfront cost of solar systems was too high, and the savings on electricity bills were too small to recover the cost over the system’s lifetime. As a result, the number of installations in NSW was miniscule, with approximately 20 systems installed per month. This finding aligns with previous studies that suggest early adopters were primarily motivated by environmental concerns and technological interest, rather than financial benefits.[28]
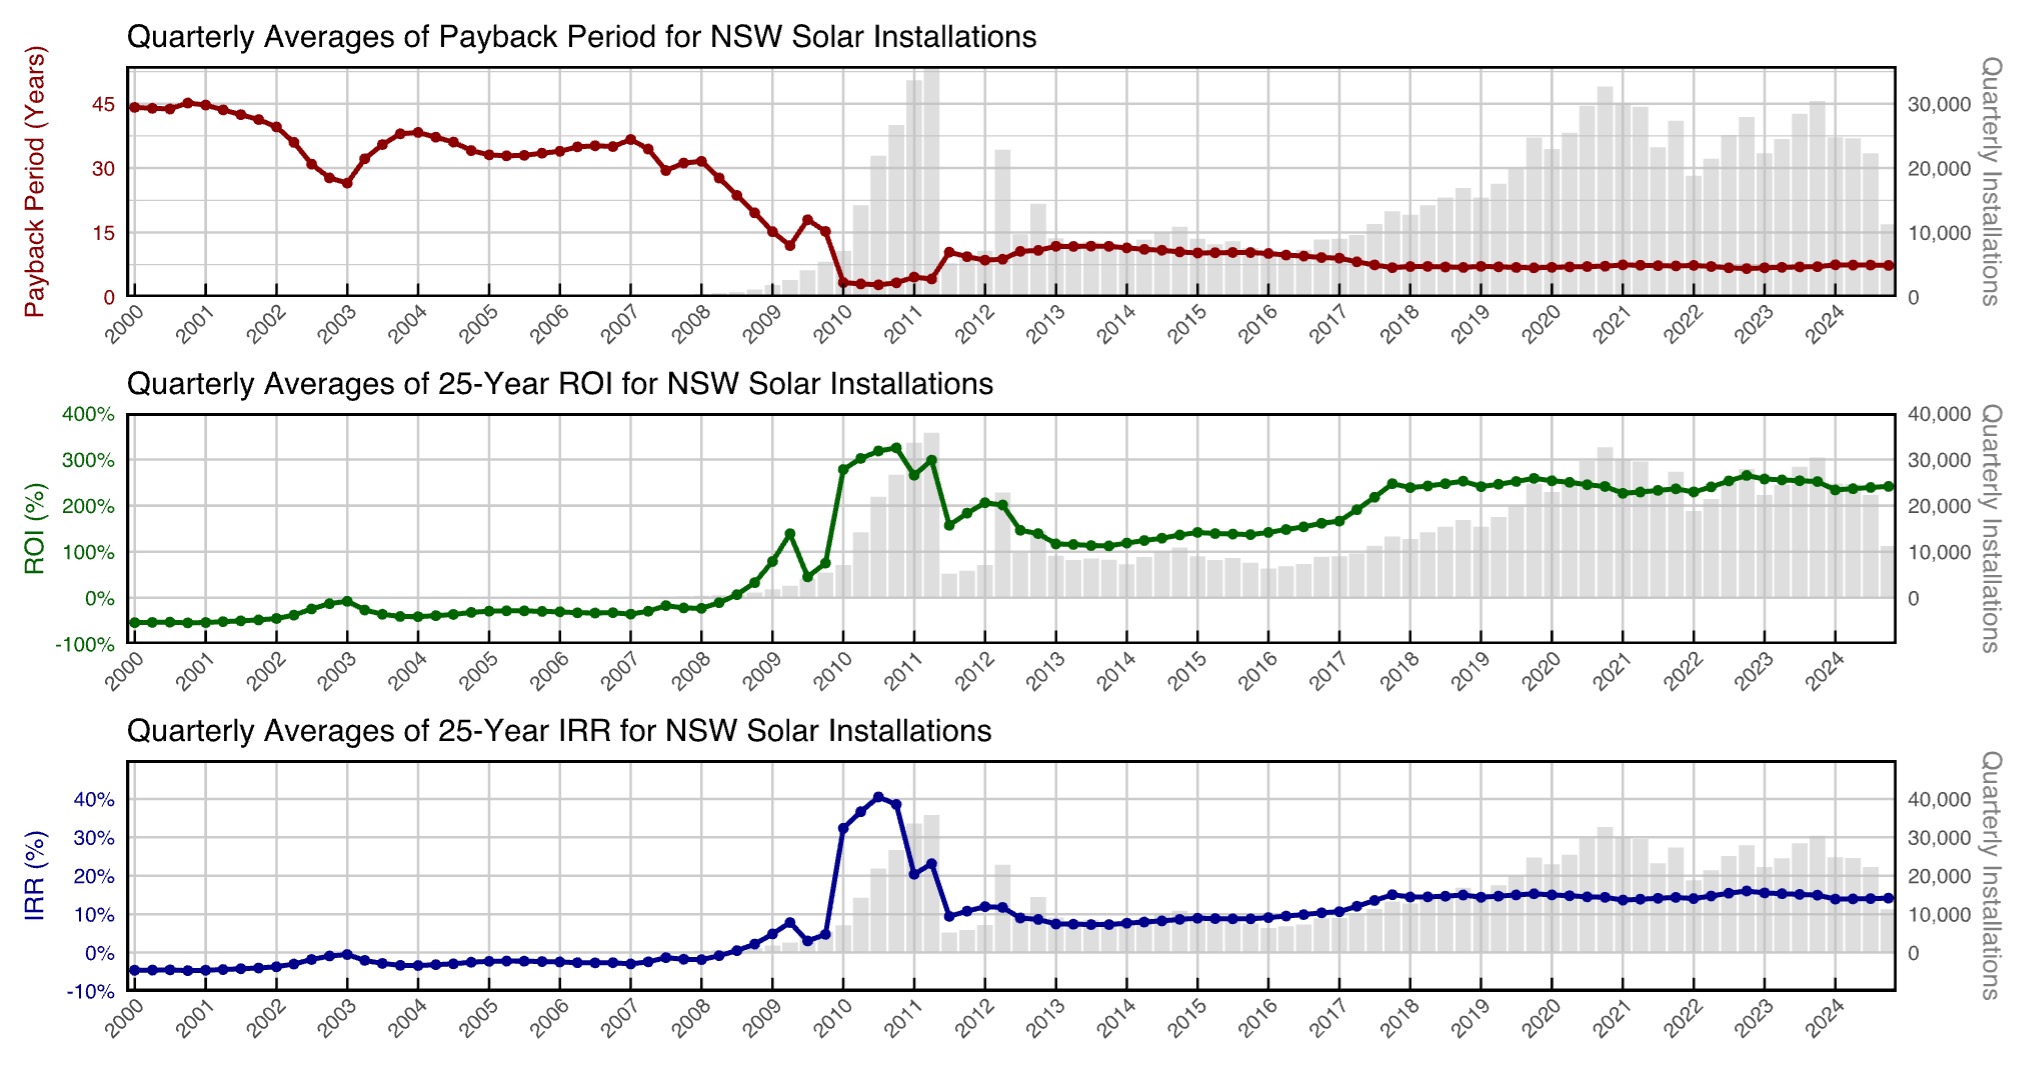
From 2008 onwards, financial returns from rooftop solar installations improved markedly. The cost of solar technology dropped, and government incentives became much more generous. In 2010, the NSW government introduced the Solar Bonus Scheme, offering generous gross feed-in tariffs. Households that secured these tariffs during this Scheme could achieve a payback period as short as two to three years for typical systems sized between 1.5 and 2.5 kilowatts during the early 2010s. For these installations, the average estimated net return was 298 percent over 25 years, effectively tripling the upfront investment over the system’s lifetime. Unsurprisingly, this period saw a surge in installations, with approximately 140,000 systems installed, equating to an average of 7,700 installations per month. This trend aligns with previous studies showing that later adopters of rooftop solar are primarily motivated by financial benefits.[29]
In April 2011, the Solar Bonus Scheme was closed to new customers. Without the high feed-in tariffs, financial returns for new rooftop solar installations moderated, and the payback period increased from four to ten years. As a result, new installations slowed down, falling to about 3,350 per month between July 2011 and December 2015. While solar still saved households money, the lower returns made it less economically attractive; especially since the rapid decline in technology costs also began to slow down.
However, from 2016 onwards, rising retail electricity prices and feed-in tariffs led to renewed growth in rooftop solar adoption. Retail electricity prices surged by 40%, increasing from 23c/kWh in 2016 to 32c/kWh in 2024.[30] Meanwhile, feed-in tariffs peaked at 13.5c/kWh in 2018 before gradually declining to 8.6c/kWh in 2024.[31] The payback period fell to approximately seven years, even as households installed much larger systems — nearly doubling in size from 5.3 kW in 2016 to 10.2 kW in 2024. This meant that even with higher upfront costs, the savings on electricity bills were large enough to offset the investment more quickly. The improvement in financial returns drove installation rates back to levels comparable to those seen during the Solar Bonus Scheme.
While government subsidies are now much smaller than they were in 2010, solar customers continue to benefit from indirect subsidies embedded in the structure of electricity network tariffs. Households with solar can reduce their grid usage and benefit from feed-in tariffs, but because network costs are primarily recovered through volumetric charges, the burden of paying for the grid shifts disproportionately onto non-solar customers. This has created an inequitable system where those without solar end up subsidising those who have it — something that will be explored in more detail in Section 4.6.
After the Solar Bonus Scheme ended, the estimated 25-year nominal IRR for rooftop solar in NSW rose from 9% in July 2011 to a peak of 16% by late 2022, then settling at around 14% by the end of 2024, with an average of 12.2% over the period. Adjusting for an average annual inflation rate of 2.55%, the real IRR for rooftop solar over this period is approximately 9.4%.[32] This return is substantially higher than the real pre-tax weighted average cost of capital (WACC) benchmarks adopted for utility-scale solar (7%) and onshore wind (7.5%) in the ISP.[33] In other words, households investing in rooftop solar are likely to expect much higher returns than the return assumed for large-scale renewable projects in the energy transition masterplan.
Figure 4. Payback period (years), 25-year ROI (%), and 25-year IRR (%) for rooftop solar installations in New South Wales from January 2000 to November 2024. The x-axis represents the installation dates, and monthly calculations are presented as quarterly averages
4. How much does rooftop solar save the grid?
The cost savings for our electricity system arising from rooftop solar generation at best comprise the marginal savings from reduced coal and gas plant generation. Our calculations indicate rooftop solar in the NEM saves the system at most 4c/kWh through averted fuel costs and variable operating expenditure at coal and gas plants.
Rooftop solar generation does not save costs for the grid through averted capital expenditure on generators. There is currently more than enough dispatchable capacity (i.e. coal, gas and hydro) to meet peak demand in the NEM.[34] As explained in Section 5.1, rooftop solar will not save on dispatchable generator’s capital costs in future, as it does not reliably reduce forecast critical peak demand, meaning 100% backup generation capacity will always be necessary for the amount of rooftop solar in the system.
Rooftop solar also does not help the grid save on distribution network costs but, in fact, increases network costs at high penetration levels due to the operational issues caused by its inherent instability, as explained in Section 5.1.
We therefore calculated grid cost savings from rooftop solar by estimating the marginal savings from reduced production from coal and gas plants, namely the displaced fuel costs and variable operating expenditure (see Appendix 11.2 for methodology). Our estimate of grid cost savings is conservative, as we do not take into account increased distribution costs arising from high levels of rooftop solar penetration.
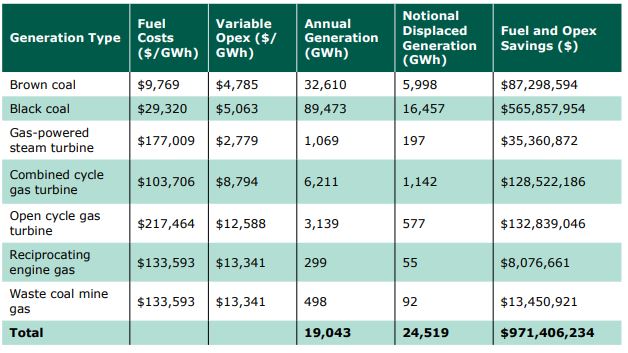
As shown in Table 2, fuel costs and variable opex ($/GWh) for each generation type were multiplied by the notional generation (GWh) for that type. The resulting estimated fuel and opex savings for each coal and gas generation type were added up, giving an annual total of $971 million, or 4c/kWh.
Table 2. Notional gas and coal generation displaced by rooftop solar (GWh) and associated fuel and opex savings ($) in the NEM
5. Rooftop solar and the distribution network
5.1 Rooftop solar does not save distribution costs through demand reduction
Renewables advocates commonly claim that rooftop solar not only reduces average demand on electricity from the grid due to self-consumption, but that it also lowers peak demand — typically referring to afternoon peaks.[35] However, for DNSPs, infrastructure planning and spending are driven by forecast critical peak demand — the highest of the peaks — rather than average or daily peak.[36] Just as bridges must be designed to withstand the heaviest load predicted to drive on them, not just the average load, network capacity must be built to accommodate extreme grid demand scenarios, not just typical conditions, within a given reliability standard.[37]
Rooftop solar cannot reliably reduce critical peak demand in each subsection of the grid, which means it cannot save on network upgrade costs without compromising reliability. As stated in AEMO’s 2024 Electricity Statement of Opportunities, rooftop solar systems “do not tend to contribute to lowering the scale of peak demands during extreme hot conditions in the summer or extreme cold conditions in the winter.”[38] Even if rooftop solar does reduce critical peak demand in one year, its lack of reliability means it may not do so in the next year. DNSPs must ensure their system capacity contains a margin above recent observed peak demands to allow for infrequent extreme weather conditions.[39] Equipment must be upgraded in accordance with forecast growth in demand regardless of any potential reductions from rooftop solar if reliability standards are to be met.
An example that illustrates why rooftop solar cannot save on network upgrade costs is the forecasting published by Energex, a Queensland DNSP. High uptake of rooftop solar in many states has greatly increased the difficulty of forecasting critical peak demand, as both demand and generation become reliant on the weather. As Energex states:
Historically, temperature was the major variable on peak demand (after systematic factors such as time of day and day of year). However, the scale of solar PV generation means that cloud cover can create variations in generation output (thereby changing the source of supply to Powerlink) greater than what would be seen from temperature changes.[40]
DNSPs do factor in the effects of rooftop solar output on forecast load profiles, including potential reductions in forecast critical peak demand, as rooftop solar has provided small reductions in previous years. In 2023, Energex estimated the 5,221 MW peak demand would have been 292 MW higher without rooftop solar, representing a reduction of 5.3%.[41] By comparison, the other Queensland DNSP, Ergon Energy, estimated a reduction of 23 MW from residential and commercial solar generation resulting in a peak of 2,637 MW — a 0.9% reduction.[42] But while these apparent demand reductions are network-wide estimates, network infrastructure experiences stress at the local level, so DNSPs must plan for forecast load growth in each subsection of the grid.[43] Ultimately, forecast local grid stress is what determines upgrade costs for a specific area. Statements that rooftop solar has provided system-wide reductions in critical peak demand in the past therefore do not support the claim that rooftop solar can be relied upon to reduce network costs in the future.
Additionally, critical peak demand reduction estimates are typically calculated on the half hour or hourly timescale. Energex uses hourly solar irradiance profiles and half-hourly maximum supply to forecast critical peak demand.[44] But these timescales cannot capture the drop in solar output that may occur from passing clouds. Ultimately, DNSPs must have enough capacity built into the grid to handle a sudden increase in load from rooftop solar households when passing clouds cause a sudden drop in generation. This happens on the timescale of seconds, as DNSPs must operate a network with a current alternating at a frequency of 50Hz, or 50 times per second.[45]
Energex has flagged recently-observed impacts on solar output from cloud cover on high-demand days:
Notably over the past few summer seasons, there has been significant weather events such as storms, or at the very least, rapid cloud cover, occurring on days with high demand. Due to the scale of rooftop solar PV uptake, if cloud cover occurs, this can create variations in solar generation output whilst internal consumption remains high, resulting in a sudden increased demand from the grid.[46]
These cloud-induced variations in output can be extreme. Data from AEMO indicate a solar farm’s output can be reduced by 80% in a 5-minute period due to passing clouds.[47] Rooftop solar systems in cities face the same problem.[48] It is therefore unsurprising that when engaging in network planning, Energex models forecast load with and without the support of rooftop solar:
These models are replicated for two network load scenarios that have been considered, native load and loading with DER [distributed energy resources, including rooftop solar]. The native load scenario provides indication of areas of the network may require augmentation due to load, impacts of phenomenon like solar masking being considered. The DER scenario highlight areas of the network that have high penetration of generation and capacity constraints or areas where capacity for Embedded Generation remains.[49]
Since customers tend to consume more electricity during peak times after installing rooftop solar,[50] solar customers contribute to load growth that may be ‘masked’ by high solar output providing critical peak demand reduction in some years. If the system has not been sufficiently augmented to handle underlying load growth due to this ‘solar masking’, there will be a significant risk of grid stress in years in which the peak occurs during a time of low solar output. Thus, the most important factor for determining which areas require augmentation arising from critical peak demand growth (and the resultant upgrade costs) is what Energex calls native load; underlying demand before solar output is factored in. If a DNSP were to rely on rooftop solar providing a given reduction in critical peak demand, it would risk such a reduction failing to eventuate due to cloud cover, and the system being unable to cope with the resultant peak. Any cost saving arising from averted network upgrades due to rooftop solar reducing critical peak demand is therefore a false economy because it simply increases the risk of reliability standards being breached, as it depends on an unreliable source of demand reduction.
5.2 Rooftop solar increases distribution costs by introducing instability
Rooftop solar is likely to increase distribution costs in an unpredictable manner. There are a wide range of estimates for network upgrade costs necessitated by rooftop solar due to the destabilising effect it has on the grid as it reaches higher penetration levels.
Unlike the traditional one-way flow from large-scale generators to consumers which the electricity grid was designed for, rooftop solar requires two-way flow between exporting consumers and the grid.[51] High penetrations of rooftop solar place stress on the grid by reducing critical minimum demand[52] and causing synchronous grid generators (i.e., coal, gas and hydro) to withdraw supply. Without the voltage management, frequency control and inertia of synchronous generators, the grid may be unable to operate safely.[53] As a result of increasing penetration of rooftop solar, operational issues may become more frequent, including an increase in power loss from distribution, voltage fluctuations and frequent operation of circuit breakers and fuses.[54]
The degraded quality of electricity supply resulting from these operational issues ultimately increases costs for consumers through shortening the lifespans of household appliances. For example, a study based on the South Australian grid found overvoltage of 10% increases the power consumption of lights by 16% and reduces their life span by 17% for fluorescent lights and 60% for incandescent lights. The study found overvoltage went from zero hours at 2018 rooftop solar penetration levels (i.e., 9%[55]) to almost 2000 hours with an additional 30% rooftop solar penetration.[56] Voltage increases of more than 20% can seriously damage appliances – as occurred in Byron Bay on June 29, when 34 houses experienced a power surge that destroyed tens to hundreds of thousands of dollars’ worth of appliances in each house.[57]
These operational issues also shorten the lifespan of distribution equipment and require greater capital expenditure by DNSPs, increasing costs passed onto consumers. Queensland’s Ergon Energy and Energex have indicated that daily minimum demand caused by the increase of rooftop solar uptake causes a range of issues that affect capex, including reverse power flow potentially reducing the life of zone substation transformers.[58] SA Power Networks is implementing voltage management services and installing prescriptive Under Frequency Load Shedding infrastructure to manage rooftop-solar-induced overvoltage and reverse power flows.[59] Currently, SA Power Networks uses a brute force method of curtailing solar when the grid is congested by deliberately inducing overvoltage to trip solar panel inverters, disconnecting them from the grid.[60] To avoid such an extreme measure in Victoria, AEMO recently introduced the Victorian Emergency Backstop Mechanism, which will allow DNSPs to remotely switch off rooftop solar systems during periods of minimum demand.[61] AEMO wants to extend this mechanism to all states in the NEM.[62]
Costs for integrating rooftop solar are near zero until hosting capacity is reached, at which point costs increase incrementally, before reaching an uncertain level at which large outlays are required for system-wide upgrades.[63] This uncertainty of the different cost thresholds leads to a wide range of estimates for total distribution network upgrade costs required to make the grid resilient in the face of high penetrations of rooftop solar. A study of the Victorian grid quantified the grid upgrade costs associated with accommodating 60% of customers having rooftop solar without resorting to broad-scale adoption of batteries and/or curtailment of solar generation.[64] Annual costs per customer ranged from $47 to $886 in rural areas and $82 to $2,525 in urban areas.[65] If costs in the upper bound of these ranges were to eventuate as rooftop solar penetration levels increase, this would place great financial strain on many customers, making it unlikely to be accepted by the public without further government subsidies.
Given the wide range of cost estimates and uncertainty surrounding cost inflection points, we have not attempted to include distribution network upgrade costs necessitated by rooftop solar in our calculation of grid cost savings per kWh of rooftop solar generation. In other words, we have assumed the costs to the system from necessary distribution network upgrades to be zero. This provides a conservative estimate of grid cost savings, meaning our analysis likely overstates the benefits of rooftop solar, particularly if network upgrade costs end up being in the upper range of estimates.
In light of a recent AER report stating DNSPs currently use only about 1% of their total expenditure to provide export services, renewables advocates have argued this indicates there are no cross-subsidies from non-solar to solar households.[66] But in fact, cross-subsidies exist, as outlined in Section 6, even before taking into account current network expenditure or any future increases in network expenditure necessitated by increased rooftop solar penetration.
6. Rooftop solar owners are earning outsized bill savings
The savings rooftop solar customers receive on their energy bills arise from self-consumption (averted usage costs) and feed-in tariffs (payments for exported excess energy), less any applicable solar meter fees. However, these bill savings are around 2 to 4.5 times larger than the 4c/kWh that rooftop solar can plausibly save the system.
Figure 5 presents CIS analysis of the median bill savings in c/kWh of solar generation for typical rooftop solar customers in the NEM with 3 kW, 6 kW, and 9 kW systems and no home batteries (see Appendix 11.3 for methodology). Customers on single-rate tariffs averted between 9 and 18c/kWh, while those on time-of-use tariffs averted between 8 and 16c/kWh. This represents substantial outsized savings from self-consumption and exports far higher than warranted, given rooftop solar generation provides at most 4c/kWh of value to the grid.
Figure 5. Bill savings for rooftop solar customers on both single rate and time-of-use tariffs exceed electricity system savings from rooftop solar generation (4c/kWh) in all NEM states and for all modelled rooftop solar system sizes
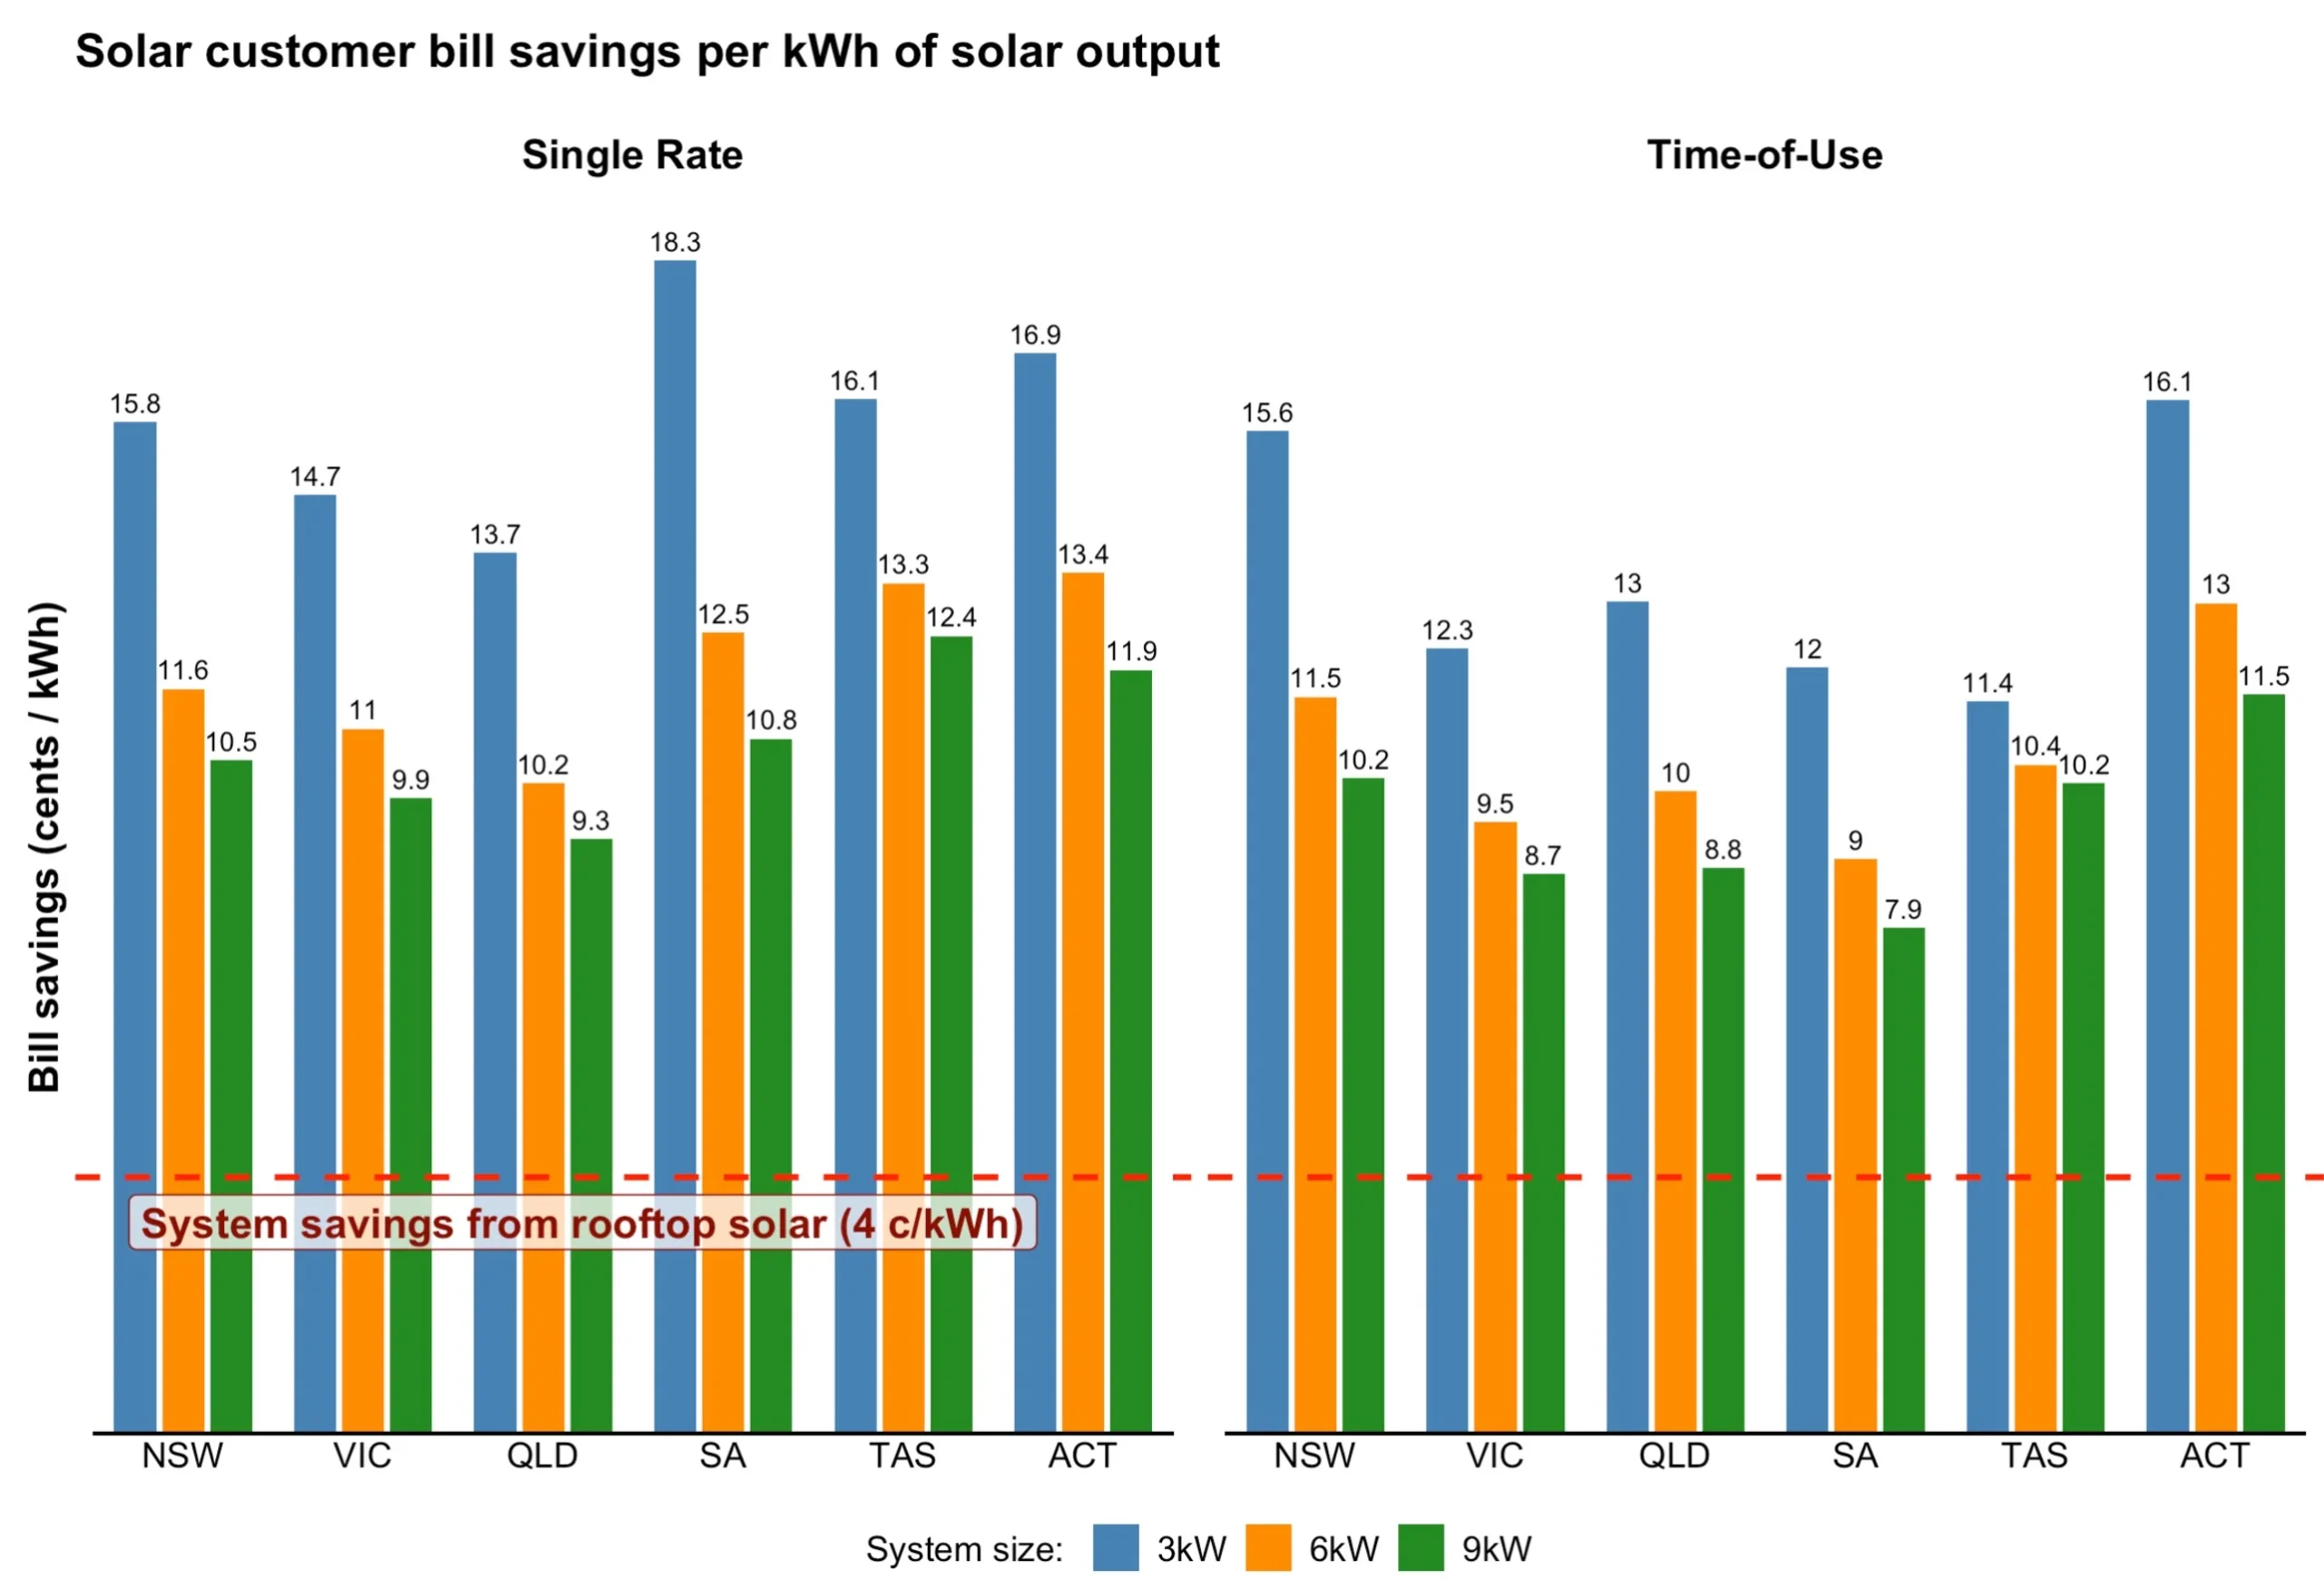
While larger systems provide smaller bill savings on a per kWh basis, this will typically translate to larger total savings on energy bills in dollar terms due to greater generation volumes for larger systems compared to smaller systems (see Section 7 for further explanation).
Single-rate retail tariffs charge the same rate for electricity usage at all times, while time-of-use retail tariffs charge different rates at different times, typically divided into ‘peak’, ‘off-peak’ and/or ‘shoulder’ rates. Given the lack of hourly self-consumption data in many states, we chose to default to the shoulder rate for time-of-use customers’ averted usage tariffs. This is because shoulder rates are typically charged during peak solar hours in the morning and early afternoon, so most self-consumption should generally occur at these rates. However, some retailers — particularly in Tasmania and Victoria — have only peak and off-peak periods, in which case the off-peak tariff was assumed to be averted. These assumptions represent an underestimate of time-of-use solar customers’ bill savings, as a portion of self-consumption will occur during peak periods — generally falling between 2pm and 9pm — during which, much higher rates are charged. Thus, most time-of-use solar customers will likely have higher bill savings per kWh than shown.
6.1 Rooftop solar owners are being cross-subsidised by non-solar customers
The gap between what solar customers are saving and the benefit they are providing to the grid demonstrates that non-solar customers are cross-subsidising solar customers. In other words, solar customers are being compensated substantially more than is warranted by the actual cost reductions their solar generation provides to the grid. Cross-subsidies arise because retailers must recoup all their costs from customers — including network charges from DNSPs — so if one group (rooftop solar owners) is given outsized savings, another group (non-rooftop-solar owners) must be charged more to cover the difference. This is reinforced by previous research indicating the average rooftop solar household avoids a disproportionately large component of network charges, which drives marginal investments in solar capacity above their otherwise efficient level.[67]
One argument for maintaining cross-subsidies is that this provides solar owners with payments representing the value of emissions reduction arising from their solar output. But as explained in Section 2, the lack of rigorous modelling supporting broadscale uptake of rooftop solar as the most cost-effective path to emissions reduction is problematic. By forcing non-solar customers to cross-subsidise solar customers, the energy bodies have created a system that is unable to provide the least-cost pathway for reducing emissions. If solar customers are to be paid according to the value of emissions reduction, this must be done in a transparent and technology-neutral manner, with rigorous modelling to determine the relative costs and benefits of different options. Cross-subsidies in network tariffs are a poor method for incentivising cost-effective emissions reduction.
Previous research has shown removing cross-subsidies from non-solar customers would have a material effect on retail bills — even under the assumption that rooftop solar provides distribution cost savings by lowering maximum demand, which is not the case.[68] If cross-subsidies were eliminated, rooftop solar installations would likely plummet, given the majority of consumers who invest in rooftop solar do so because of the financial benefits, as illustrated in Section 3.
AEMO’s ISP relies on a four-fold increase in rooftop solar in the National Electricity Market by 2050.[69] One analysis suggests an average cost of $18,000 for each customer to achieve such a large increase.[70] The question remains as to how this will be achieved without cross-subsidies causing intolerably high bill increases for the remaining consumers who do not have rooftop solar. To reach this goal, governments would need to introduce even greater subsidies for electricity bills, further burdening the taxpayer and stoking inflation.
6.2 Current tariff structures enable cross-subsidies at the expense of consumers without rooftop solar
The cross-subsidies from non-solar to solar customers have been enabled by the current network tariff structure. This structure, while not strictly ‘cost-reflective’, has historically worked well enough to deliver fair outcomes for consumers — until rooftop solar was adopted en masse, introducing substantial cross-subsidies.
Current network tariffs are structured in such a way that DNSPs recoup 60-75% of their costs from variable usage charges rather than fixed charges.[71] This general structure is passed on to consumers by retailers through variable retail tariffs and fixed daily charges, with network charges making up around half of retail bills.[72] Prior to the broadscale adoption of rooftop solar, relying on usage as a proxy for calculating network charges was a relatively fair way of spreading network costs across the customer base, as a customer’s overall usage was highly correlated with their peak demand in previous decades.[73]
But with current levels of rooftop solar penetration, these network tariff structures — including single-rate and time-of-use — fail to accurately reflect the costs of serving each customer. Charges are predominantly based on usage occurring outside times of critical peak demand. This enables solar customers — who can greatly reduce their consumption during non-critical-peak times — to receive outsized savings, despite not providing material savings on distribution network costs by reducing forecast critical peak demand, as outlined in Section 5.1.
6.3 Rooftop solar: reverse Robin Hood
The cross-subsidies from those who have rooftop solar to those who do not is a form of ‘reverse Robin Hood’; taking from the poor to give to the rich. This is largely because it is much more difficult for apartment owners and renters to install rooftop solar than those who own a house, and apartment owners and renters tend to be less wealthy than house-owners.[74]
The current cost-of-living crisis has brought to the forefront the inability of many households to pay their electricity bills, particularly those on lower incomes. From 2022 to 2023, as network costs increased, there was an 18% increase in the number of customers struggling to pay their electricity bills.[75] Over 250 households were disconnected every week during the 2022-23 financial year and a 2023 survey of NSW households found more than half of disconnected households earned less than $80,000 a year before tax.[76] Rooftop solar cross-subsidies are an added burden for many consumers that are already struggling to pay their electricity bills and avoid disconnection.
Rooftop solar cross-subsidies also represent a wealth transfer from younger generations to older generations. Less than half of those aged 25 to 34 are homeowners, indicating that most young people will be paying cross-subsidies to older rooftop-solar owners, since renters are much less likely to install rooftop solar.[77] This is confirmed by a 2017 Ausgrid survey, which indicates rooftop solar ownership skews towards being older, generally between 54 to 72 years old, while those without solar are more evenly spread in age.[78] A 2024 study also found that the more millennials (aged 25 to 40 at the time of the 2021 census) living in a postal area, the fewer the number of rooftop solar units.[79] Eliminating these cross-subsidies is therefore necessary to end the ‘reverse Robin Hood’ disproportionately affecting less wealthy and younger households.
7. Export charges will not end cross-subsidies
One solution to the rooftop solar dilemma being implemented by some DNSPs is the introduction of two-way export tariffs. This involves charging and rewarding customers for rooftop solar exports during low and high demand periods, respectively. Theoretically, this should reduce the amount of solar being exported into the grid when there is not enough demand to soak it up, while encouraging exports that can help meet peak demand. This may reduce upgrade costs caused by oversupply of rooftop solar exports on sunny days — if the price signal is passed on in retail offers, for which there is no guarantee. But even if export tariffs were passed on to solar customers, they can only reduce the existing cross-subsidies, not eliminate them entirely. Rooftop solar customers will still be able to receive substantial outsized savings on their bills, which will particularly benefit those with smaller systems and higher rates of self-consumption.
7.1 Two-way export tariffs introduced, but not everywhere
DNSPs in some states have considered two-way export tariffs but are yet to introduce them. Queensland’s Ergon Energy and Energex contemplated two-way export tariffs but ultimately decided to defer their introduction beyond 2030.[80] Similarly, TasNetworks and NT’s Power and Water Corporation are yet to exhaust export hosting capacity so have also deferred introducing two-way tariffs.[81] While ACT’s DNSP Evoenergy submitted two-way pricing for residential customers in its draft 2024-2029 tariff structure proposal to the AER, it later removed two-way pricing from its proposal, citing “significant costs and implementation complexity of residential export tariffs within its billing system”.[82]
DNSPs in other states have not yet even considered introducing two-way export tariffs. WA’s Synergy and Horizon Power have introduced different export reward tariffs for peak and off-peak periods but are yet to introduce two-way tariffs.[83] In Victoria, minimum feed-in tariffs rewarding solar customers for exports are set by the Essential Services Commission, which is yet to introduce two-way tariffs. However, the flat minimum feed-in tariff rate is already comparatively low at 3.3 c/kWh in 2024-25 and will drop to almost nothing at 0.04 c/kWh in 2025-26, with variable off-peak rates also dropping significantly from 2.1-2.8 c/kWh to zero.[84] If this trend continues, a charge period may be introduced in future.
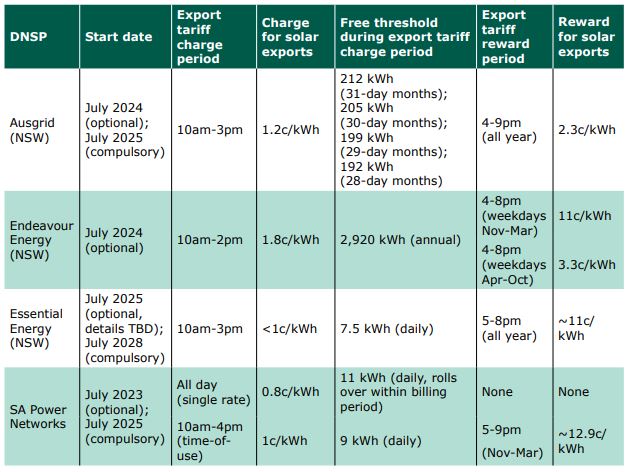
NSW and South Australia are the only states in which all DNSPs have introduced or are in the process of introducing two-way export tariffs, as outlined in Table 3.[85] These tariffs are meant to improve ‘fairness’ for consumers, particularly to ensure those without export-enabled rooftop solar or batteries do not pay more than they should.[86] The charges for exports above a free threshold during peak solar hours are meant to help cover the costs of increased stress on the grid, with rewards incentivising customers to shift exports to evening peak times — typically by investing in a battery.[87]
Table 3. Two-way export tariff charge and reward rates for NSW and SA DNSPs
7.2 Rooftop solar owners continue to earn outsized savings under two-way export tariffs
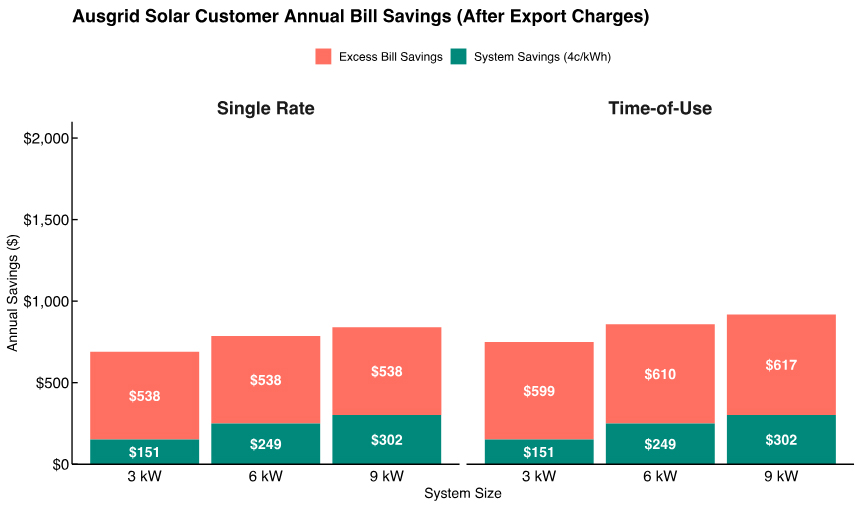
CIS tested the effect on solar customers’ bill savings if retailers were to directly pass on the two-way export tariffs being implemented by Ausgrid, the largest DNSP in Australia (see Appendix 11.4 for methodology). Under the current tariff structure, Ausgrid solar customers save on average 14–24 c/kWh of solar generation from self-consumption and exports — 3.5 to 6 times the value their solar output provides to the grid (Figure 6). This translates to an average annual bill saving of $705 to $1,186 more than is deserved (Figure 7). If Ausgrid’s two-way export tariffs were passed through directly to consumers while usage rates remained the same, overall savings would drop only slightly to between 11 and 20c/kWh (Figure 6), translating to a total of between $538 and $617 in excess bill savings (Figure 7). This shows export tariffs are a step in the right direction and will help reduce solar cross-subsidies, but are too soft a measure to eliminate them entirely.
Figure 6. Average annual bill savings per kWh for Ausgrid rooftop solar customers on both single rate and time-of-use retail tariffs remain substantially higher than electricity system savings from rooftop solar generation (4c/kWh) when two-way export tariffs are applied regardless of system size. Curtailed solar energy arising from the introduction of export tariffs has been excluded from customers’ total solar generation.
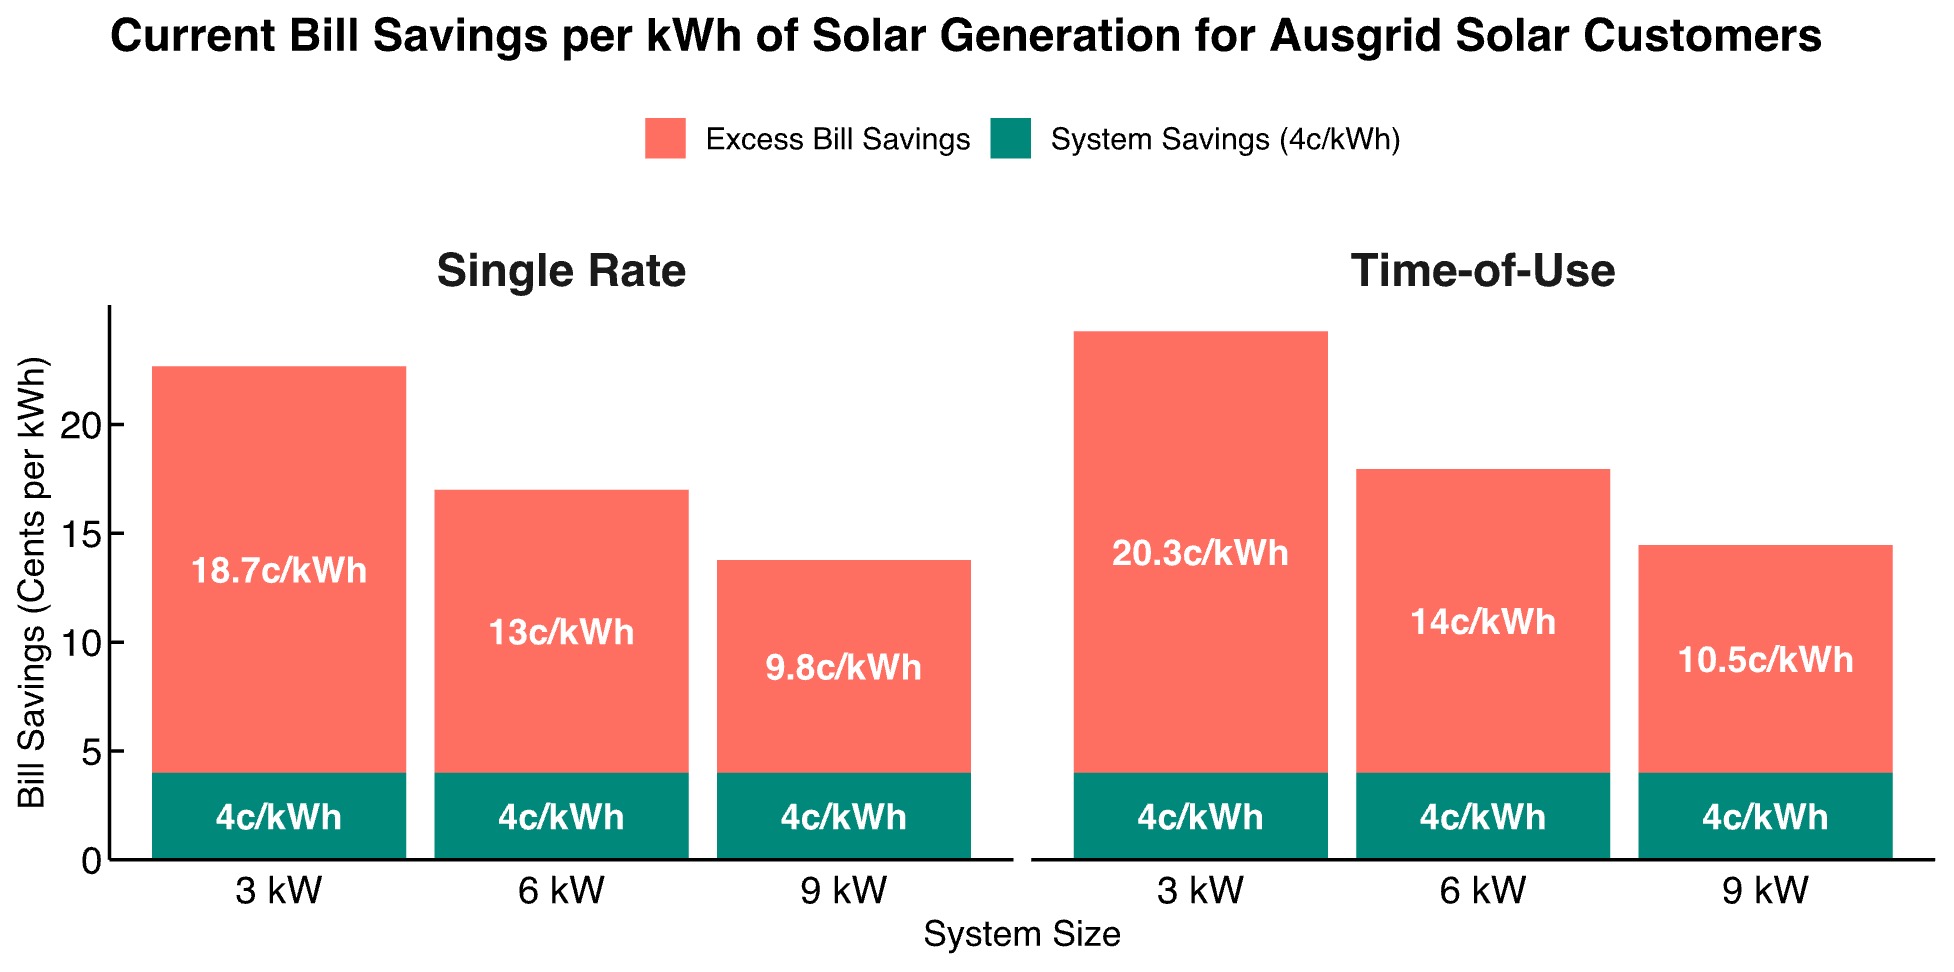
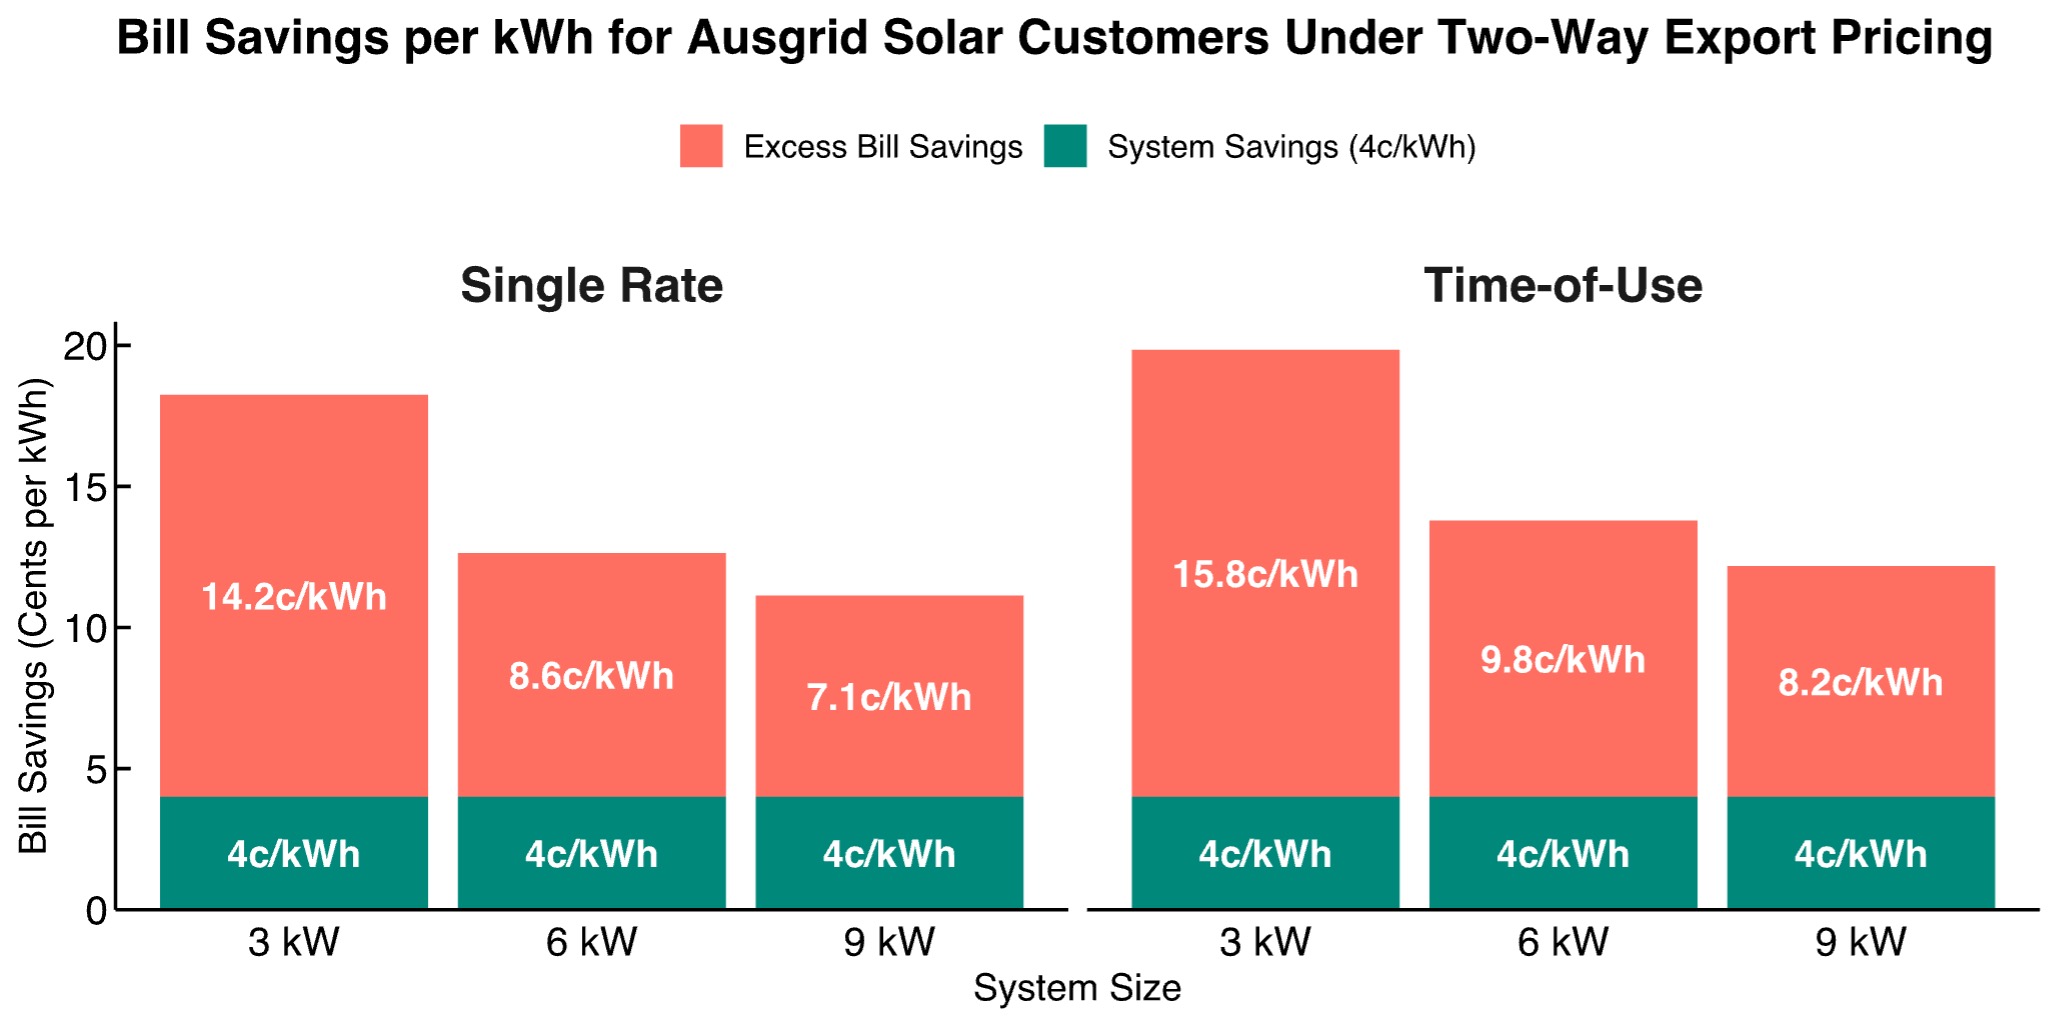
Figure 7. Average annual bill savings for Ausgrid rooftop solar customers on both single rate and time-of-use retail tariffs remain substantially higher than electricity system savings from rooftop solar generation (4c/kWh) when two-way export tariffs are applied regardless of system size. Curtailed solar energy arising from the introduction of export tariffs has been excluded from customers’ total solar generation.
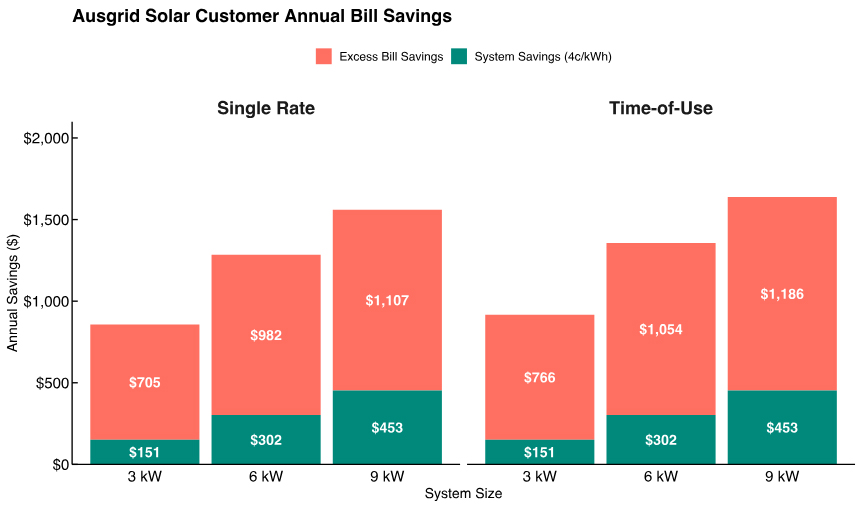
The trend of bill savings per kWh decreasing with system size is reversed for total bill savings. This is because smaller systems have lower export ratios (see Figure 10 in the Appendix). A 3 kW system saves consumers more on a per-kWh basis than a 6 kW or 9 kW system because a greater proportion of generation is being self-consumed and therefore saving averted usage rates — which are currently much higher than export rates. However, the greater volumes of generation from larger systems translates to higher total bill savings arising from increases in both exports and self-consumption.
After two-way export tariffs are implemented, the trend of increasing total bill savings with increasing system size is greatly diminished. This is because the higher export ratio of larger systems means most of the kWh being produced are not able to be self-consumed, so a large proportion of the kWh that would have been exported must be curtailed, attracting no savings. This suggests consumers will likely opt for smaller system sizes for new installations and replacements if retailers pass through export tariffs.
The analysis assumed solar customers would curtail any exports above the free threshold during the charge period rather than face charges. However, even if customers do not curtail exports and instead incur charges for excess exports, this would amount to only a small reduction on their overall bill savings of $0, $16 or $45 for 3 kW, 6 kW and 9 kW systems, respectively.
This analysis assumes all retailers pass on the price signal of export tariffs to customers. However, this is not guaranteed as some retailers have already indicated they wouldn’t be passing the cost along on a consumer-by-consumer basis, and instead would spread costs across their customer base — effectively continuing existing cross-subsidies for rooftop solar.[88]
Notably, the ISP’s assumed four-fold increase in rooftop solar by 2050 depends on sustained growth in average system size.[89] Both consultant reports used as inputs for the ISP’s rooftop solar forecasts predict further increases on the current average size for new systems of around 8 kW, with CSIRO’s forecast peaking around 9 kW,[90] while GEM’s forecast continues to grow to almost 12 kW by the mid-2050s.[91] If export tariffs are passed through to customers by retailers — or cross-subsidies from non-solar customers are otherwise significantly reduced or eliminated — these projections are highly unlikely to eventuate. This is because solar customers expect a return on their investment, as shown in Section 3, and these changes would only serve to reduce the optimal system size for the average customer.
DNSPs implementing export tariffs will not end cross-subsidies, as rooftop solar owners will continue to earn outsized savings through self-consumption, even if retailers do pass through the two-way tariff structure. While export tariffs are a step in the right direction, more radical network tariff reform is required to reflect the true value of rooftop solar to consumers.
8. Batteries will not lead us to paradise
Batteries have often been portrayed by renewables advocates as the silver bullet that will solve the network problems caused by rooftop solar and help secure an energy paradise for all. The Prime Minister has even used the supposed financial benefits of rooftop solar and home batteries as evidence that large-scale solar and batteries will benefit the economy.[92] But, as with rooftop solar, the availability of batteries for reducing critical peak demand is not guaranteed — and if it were, consumers would likely end up paying more to battery owners than they would save from any battery-induced reduction in network upgrade costs.
With the advent of export tariffs, some rooftop solar owners — 1.6% as of 2022[93] — are buying home batteries to allow them to store their solar energy for exporting back into the grid during peak hours.[94] This helps ensure they receive greater rewards and avoid charges in the two-way tariff system. However, many environmental and consumer groups have called for existing rooftop solar subsidies and rebates to be extended to home batteries.[95] This is because, for most rooftop solar owners, batteries are unaffordable and show no signs of getting cheaper any time soon.
AEMO’s ISP assumes a 30-fold increase in consumer batteries connected to the grid by 2050,[96] but one analysis suggests this would cost $20,881 per customer.[97] Even the GEM battery forecast, which is used as an input to the ISP, concedes that home batteries are “yet to reach levels of financial attractiveness… that would support mass-market uptake”.[98] The GEM report cites one of the underlying drivers of its forecast increase in battery uptake over the next several years as consumers having “a misapprehension that the battery will leave them financially better off or at least shield them from what they believe will be further large rises in electricity prices”.[99] In other words, it assumes a material proportion of consumers will buy batteries that will not benefit them financially.
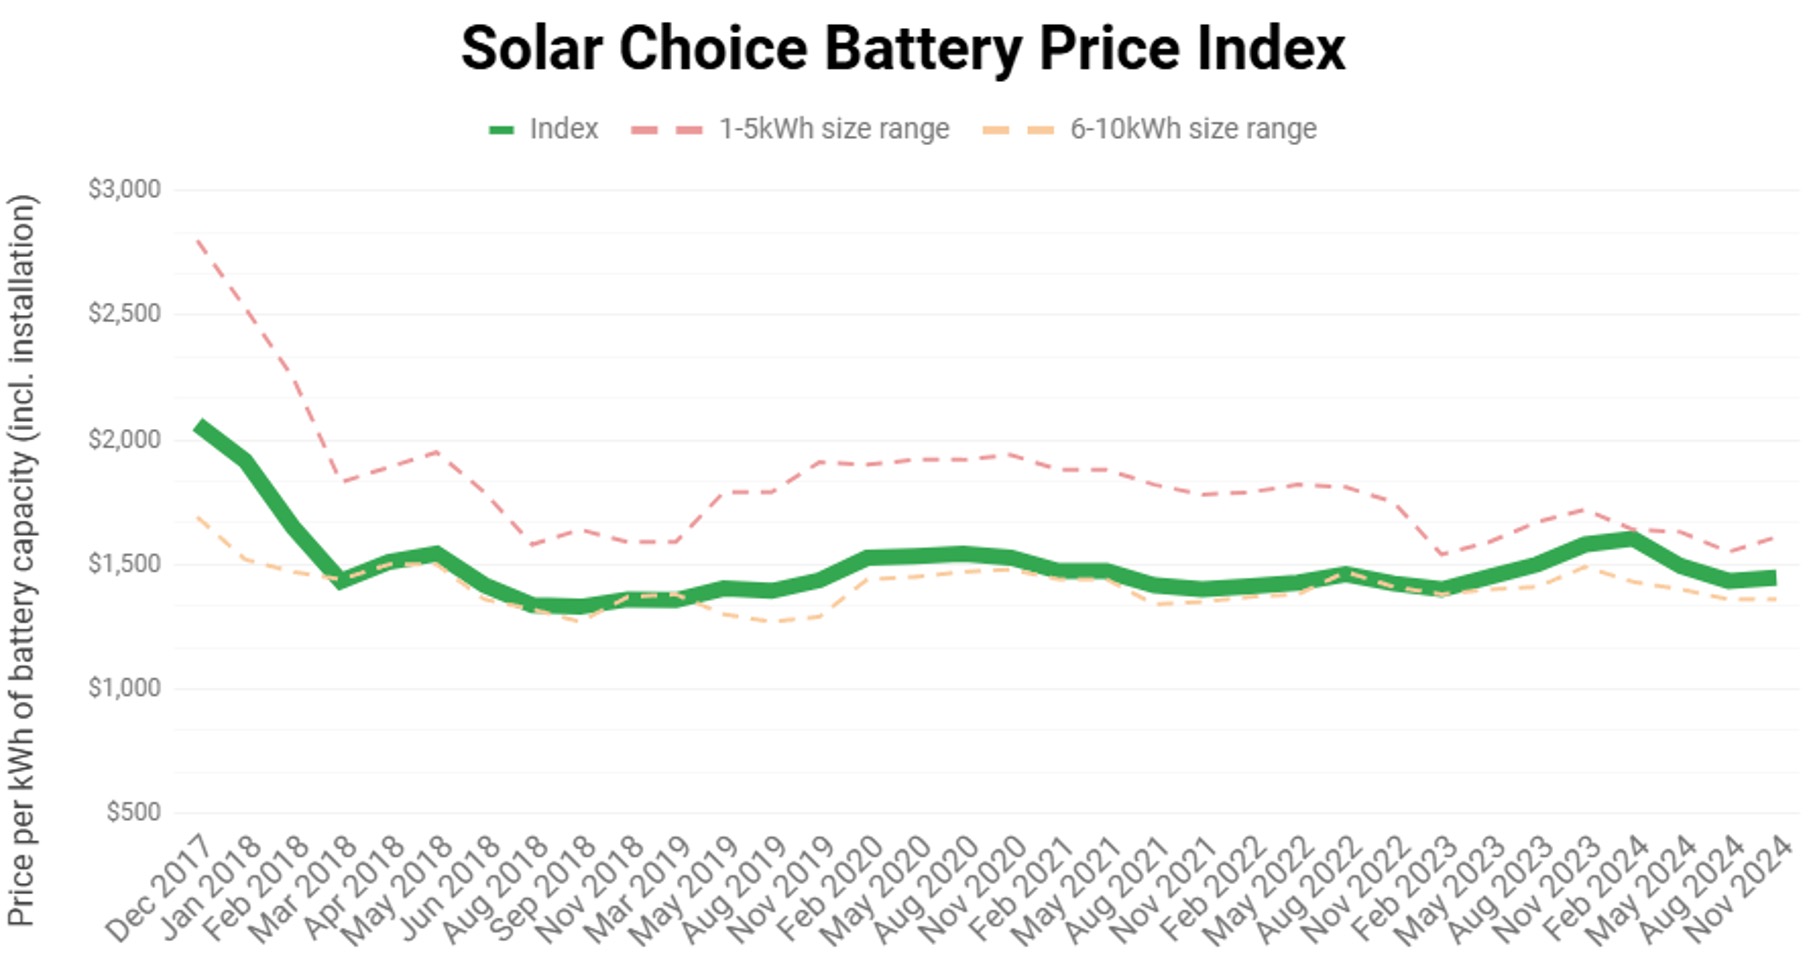
The GEM report’s forecast accelerated uptake of battery systems from 2026 onwards depends on the assumption that the federal government will provide rebates equivalent to half a battery’s value.[100] Concerningly, GEM has not provided an estimate of the cost of its assumed government subsidies. The report also assumes battery prices will fall dramatically in future, citing “a halving in costs… as a rule of thumb for an inflection in uptake”, with this occurring between 2023 and 2030.[101] The AEMC’s research is even more optimistic, pegging 2025 as “the year domestic batteries reach the affordability tipping point”.[102] But such price falls are far from guaranteed. According to the Solar Choice Battery Price Index, prices have remained flat for the past six years, as shown in Figure 8.[103]
Figure 8. Solar Choice Battery Price Index showing home battery prices remained relatively flat from 2018 to 2024.
Consumers who cannot afford batteries have also argued that the government should provide subsidies, given the government encouraged consumers to install rooftop solar in the first place. As one Queenslander said, “It’s getting super expensive to have a [rooftop solar] system, but I’m not getting any help from the government to permit me to use that system to its fullest benefit, whilst helping the government and AEMO and electricity retailers manage the grid.”[104] Senator David Pocock expressed a similar sentiment from rooftop solar owners in the recent Senate inquiry:
One of the concerns I have raised with me is that people make these [rooftop solar] investments. They are generating electrons just like the big power plants and yet they would be having dynamic pricing forced on them without any notice by some of the retailers. At times they are having their feed-in constrained.[105]
This illustrates the political problems that arise when governments, energy market bodies and industry players all tell consumers that investing in rooftop solar will usher them into a paradise of lower bills while helping reduce costs and emissions for the rest of the grid. Consumers have been given a distorted picture of what their investments are doing to the grid. As illustrated in Sections 4 to 6, the benefits of rooftop solar have been massively oversold — not all electrons deserve the same compensation. Large-scale, dispatchable plants provide stability and reliability to the grid while rooftop solar reduces stability and reliability of supply. As rooftop solar installations increase, the competition between neighbouring solar systems that are perfectly correlated in output becomes fiercer, further eroding the value of rooftop solar generation and putting pressure on the grid. This then drives DNSPs to reduce rewards for exports and increase charges. Consumers have been left feeling betrayed and entitled to further government handouts in the form of battery subsidies.
8.1 State government battery subsidies have largely failed to increase uptake
Most state governments have already introduced subsidy programs for batteries, with some having since closed with no signs of re-opening. The number of batteries installed under these programs amount to little more than a rounding error when considering the total number of solar customers in each state, and the number of solar systems continuing to be installed every year. AER data from 2023-24 indicates only 4% of export customers used batteries in conjunction with their solar systems and only 16% of new export-enabled solar systems incorporated a battery.[106] As AEMC Chair, Anna Collyer, said in a recent speech:
At the end of 2023 around 250,000 Australian households and small businesses had installed batteries. That’s a strong number, but nothing like the 3.7 million rooftops currently sporting solar panels. There’s still a long way to go for domestic batteries to significantly soak up the glut of solar we see in the middle of many days.[107]
The SA government introduced a Home Battery Scheme in 2018, offering a $6000 subsidy eventually wound back to $2000 before being scrapped in 2022 by the newly elected government.[108] As then-new Energy Minister Tom Koutsantonis explained, the program had “minimum uptake and follow-through” and “has not even reached half of its targeted 40,000 homes” because “the market signals weren’t working, there wasn’t sufficient money left to meet the target”, insisting “you’ve got to reach a point where you say ‘this has failed so we’re getting out’”.[109] The government’s own online calculator estimated a rooftop solar owner with a 10 kW system would lose around $1200 and $2300, respectively, by purchasing a 6 kWh or 10 kWh battery, even including the subsidy. Larger battery sizes provided only marginal benefits for consumers, of around $700 in value for a 10 kWh or 14 kWh system.[110]
The Queensland government also introduced a subsidy of $3000 to $4000 for low-income earners to purchase a battery for solar systems in February 2024 but closed the program only a few months later in May.[111] The government has not revealed how many batteries were installed under the program, but as the $16 million funding allocation appears to have been exhausted, about 4,000 to 5,300 batteries were likely subsidised.[112] This represents at most 1% of the more than 460,000 Queensland consumers who exported solar power in 2023-24.[113] Queensland’s newly-elected Coalition government has made no mention of any plans to revive the program.
As part of the Solar Homes Program, the Victorian government started offering solar battery rebates of up to $4,174 in 2019.[114] However, in 2023 the government switched to offering Solar Battery Loans of up to $8,800 to be repaid over 4 years.[115] The government has acknowledged that “adding a battery to an existing solar PV system is a significant investment, and for some households the outlay might be more than what you save on energy bills over the life of the battery.”[116] From the launch of the initial battery subsidy in July 2019 to November 2024, 18,534 batteries have been installed under the Solar Homes Program.[117] However, as of the end of 2023-24, the proportion of exporting solar customers in Victoria with a battery remains below 3%.[118] The Solar Homes Program also provided rebates of up to $1,400 on almost 300,000 solar panel installations over the same time period.[119] This means rooftop solar installations have outpaced battery installations 16:1 under the government’s scheme, which will worsen cross-subsidies and increase pressure on the grid from oversupply of solar. Foundational weaknesses of the program were highlighted in a damning report by the Victorian Auditor-General’s Office in 2021:
DPC’s Solar Homes Program Design and Options Report was insufficient to lay out and make the case for government intervention. It was not a business case and did not explain why the best solution to the identified need of reducing Victorians’ energy costs is rebated solar photovoltaic (PV) panels, batteries, and solar hot-water systems… DPC also did not consider the ‘do nothing’ option as a benchmark for assessing the program’s value proposition despite existing growing demand for solar PV panels and the potential adverse impact of accelerated solar PV panel uptake on the state’s electricity grid.[120]
The Tasmanian government also offers loans up to $10,000 under the Energy Saver Loan Scheme, covering a range of “energy efficient products”, including batteries.[121] From its inception in October 2022 to January 2025, the program supported the installation of less than 200 batteries[122] — a mere 0.4% of the more than 49,000 Tasmanian customers who exported solar power in 2023-24.[123]
Following the introduction of export tariffs by DNSPs, the NSW government responded by introducing a home battery subsidy of $1600 to $2400 for rooftop solar owners, as well as a $250 to $400 incentive for connecting to a VPP from November 2024.[124] Given the track record of battery subsidy programs in other states, it seems unlikely the latest NSW attempt to increase uptake will make much of a difference.
State government subsidy and loan programs represent a failed attempt to facilitate broad-scale adoption of batteries, as the small increase in uptake they have provided has been entirely dwarfed by Australia’s rapidly increasing, massive rooftop solar stock. Rather than continuing these programs or launching new battery subsidies, federal and state governments should consider better uses of these funds that would provide more value to all consumers, such as ensuring sufficient supply of dispatchable grid-scale generation.
8.2 Batteries are unlikely to save distribution costs
Unlike rooftop solar, batteries can be dispatched at will during peak times, lowering self-consumption or exporting to the grid. However, it does not follow that batteries are a reliable source of critical peak demand reduction. In order for batteries to provide a given reduction at the moment critical peak demand hits, two critical factors have to simultaneously align: wholesale price spikes coinciding with critical peak demand events in the local network, and battery owners and VPPs accurately predicting when critical peak demand will hit. Both of these factors increase the uncertainty of a given level of battery discharge occurring during critical peak demand. Combined with the high cost of home batteries, this casts doubt on the viability of using batteries to reduce critical peak demand, and therefore network upgrade costs.
The first factor that undermines the ability of networks to rely on batteries for critical peak demand reduction is the misalignment between wholesale prices and local distribution critical peak demand events. The Blunomy report commissioned by Energex and Ergon Energy for their home battery forecasts assumes batteries operate under one of two goals: “one to maximise self-consumption from on-site solar generation (solar soaker), the other to maximise available revenues from wholesale energy market (as the battery acts as a VPP)”.[125] If a battery owner or VPP is maximising wholesale (i.e., generation market) revenue, it will optimise batteries discharging when wholesale prices are highest. Wholesale price spikes at the system level may occur at a different time to the moment of critical peak demand at the local grid level. This lack of perfect correlation means the level of discharge provided by batteries during critical peak demand events is uncertain, and therefore batteries are not a reliable source of critical peak demand reduction. If DNSPs want to incentivise battery owners and VPPs to optimise their battery discharge profiles to reduce critical peak demand, they will have to pay them for this service, which will increase network costs.
However, even if battery owners and VPPs did aim to reduce critical peak demand, they will not do this perfectly. VPPs and battery owners cannot know when critical peak demand will hit, a problem known as imperfect foresight.[126] This means batteries may not have sufficient charge when they are needed due to discharging too much before the critical peak, or they may hold off on fully discharging in anticipation of a higher peak which does not occur. This unpredictability of demand makes the amount of battery discharge available at any given time uncertain. Also, at present, DNSPs have limited visibility of battery penetration, which has limited their ability to accurately forecast the impact of batteries on the local network. As Energex has stated, “Forecasting the impact of batteries can prove difficult as the impact of energy storage on customer energy consumption is not directly metered, and there has historically been little high-quality data surrounding the number and size of batteries being installed.”[127]
The combination of these factors calls into doubt whether home batteries are an optimal solution to reduce network costs. Even if they could reliably provide modest reductions in critical peak demand, this cost could be substantial compared to other alternatives. As outlined in the sections above, the lack of affordability of batteries for many customers and the failure of government subsidies to promote broad-scale uptake raises serious doubt over whether batteries can provide net savings for the grid. Until proven otherwise, policymakers should resist calls to subsidise home batteries with taxpayer funds.
9. Ending the cross-subsidies: difficult but necessary
The Australian Energy Market Commission and Australian Energy Regulator have attempted to introduce network tariff reforms to improve cost-reflectivity and allow CER such as rooftop solar and home batteries to be integrated onto the grid “as efficiently as possible”.[128] However, these reforms do not constitute enough of a change in tariff structure to eliminate cross-subsidies to rooftop solar owners — in fact, they may make cross-subsidies worse in the short term for some customers. Ending the cross-subsidies will require very different and much more radical reform, which will be difficult but necessary. In an ideal world, immediate remedy is preferable, but in the real world, difficulties arise because the energy system can’t change rapidly. This is largely because our regulatory system values avoiding bill shocks — electricity as a fundamental service means sudden changes can create political backlash that undermines any attempts at reform.
The energy market bodies have encouraged DNSPs to move customers from single-rate network tariffs onto time-of-use and demand network tariffs. Time-of-use and demand network tariffs have been labelled as ‘cost-reflective’,[129] despite neither of them being so.
Time-of-use network tariffs typically charge based on the amount of usage in peak, off-peak and shoulder periods every day, despite this being irrelevant to network upgrade costs. As explained in Section 5.1, these costs are largely determined by the single highest peak in each year, or several years. A time-of-use retail tariff structure is useful for recouping generation costs since spot prices tend to have daily peaks in the mid-afternoon and evening,[130] but time-of-use tariffs should not be used to recoup network costs. CIS analysis of all states shown in Figure 5 in Section 6 indicates moving customers onto time-of-use tariffs from single-rate tariffs may provide a modest reduction in outsized savings for solar customers, though substantial cross-subsidies would remain. However, this analysis uses only the shoulder rate (or off-peak rate when no shoulder rate exists) for calculating savings from self-consumption due to a lack of data in most states. Given self-consumption during peak periods will avoid the typically much higher peak rate, this analysis likely underestimates the savings of time-of-use solar customers. More detailed analysis using hourly data from Ausgrid solar customers and the usage rates structure of the three largest retailers suggests that time-of-use solar customers in some areas are earning more savings than single-rate customers (Figures 4, 5). Thus, moving customers from single-rate to time-of-use network tariffs, as current reforms are doing, may in fact increase solar customers’ savings and make cross-subsidies worse.
On the other hand, demand tariffs are the most cost-reflective residential network tariff currently offered by most DNSPs. However, these tariffs still charge customers using a largely irrelevant measure – their highest monthly demand during seasonally determined ‘peak’ time windows – rather than the single critical peak of the year, or several years.[131] This means only one twelfth (or twenty-fourth, or thirty-sixth etc.) of the price signal is being passed onto consumers, since peak demand in 11 months of every year will have a negligible cost impact — only the single highest day of the year, or several years, matters (see Section 5 for an explanation of how critical peak demand drives network costs). Demand tariffs are therefore not truly cost-reflective either.[132] Moving all consumers onto demand tariffs would help to reduce the outsized bill savings of rooftop solar customers, who would find it harder to lower their grid demand and avoid network charges through self-consumption during evening peak periods. But demand tariffs passing on only a twelfth or less of the price signal means they are still too blunt of a tool to eliminate solar cross-subsidies altogether. Moving customers from single-rate and time-of use network tariffs to demand network tariffs is a step in the right direction but this alone will not achieve cost-reflectivity great enough to ensure fair tariff structures for all consumers.
There are a number of network tariff structures that would be sufficiently cost-reflective to eliminate cross-subsidies to solar customers, though each will have its challenges when it comes to implementation. Six options are outlined below, though there may be other variations that could eliminate cross-subsidies. Of the six options, the final option — a fixed charge based on residence type — is likely the most feasible way to eliminate solar cross-subsidies while minimising unintended side effects. Note that these solutions deal only with the network tariff component of retail tariffs — they do not propose any changes to the generation component of retail tariffs, for which a variable charge based on usage is warranted.
9.1 Large fixed component and small variable critical peak charge
The first option — arguably the most cost-reflective network tariff — is a larger fixed supply charge and a smaller variable critical peak charge based on a customer’s contribution to critical peak demand in the previous year, or several years. A larger fixed charge helps to eliminate cross-subsidies from non-solar to solar customers, while the smaller variable charge ensures all consumers receive a price signal accurately reflecting their impact on network upgrade costs. However, challenges arise with implementing this for customers who move frequently, as customers would likely object to being forced to pay variable network charges for a whole year based on a previous tenant’s contribution to critical peak demand. Alternatively, customers could instead be charged based on their contribution to critical peak demand at their previous residence but, again, this causes problems for those who move to an area with a different DNSP. Previous demand may have no correlation to a customer’s future demand during a critical peak demand event. This structure may also face substantial political opposition. It may be perceived as unfair by customers facing bill increases because they happened to be home and using appliances during the critical peak day, while their neighbour who was on holiday that day pays no variable charge and therefore enjoys a bill decrease for the year. This perceived unfairness has already caused consumers to complain about ‘softer’ existing demand tariffs, which include a variable charge based on the 12 peak days of the year rather than a single day.[133]
9.2 Large fixed component and small variable critical peak charge with SMS
The second option is like the first, with the added feature of SMS notifications. Customers can opt-in to be notified when a potential critical peak is about to occur, giving them a chance to rearrange their schedules to lower their usage during the peak period and reduce their bill. This system already exists for AusNet business customers, though their current critical peak demand tariff is based on the average maximum demand across five time windows of potential critical peaks selected every summer.[134] A larger fixed charge and smaller variable critical peak demand tariff based on the single highest peak over one or several years would be more cost-reflective than AusNet’s tariff. The problem with this tariff structure is it creates a substantial opportunity cost for many customers and may not be feasible for some, particularly the elderly, those with disabilities or families with young children. The impact on families, even from existing ‘softer’ demand tariffs, has already been criticised by consumers as “wrong”, “almost arbitrary” and “a stick without a carrot”.[135] This tariff structure could therefore face substantial consumer backlash by rewarding those who can be flexible and punishing those who cannot.
9.3 Fixed charge only based on land or property value
The third option is to compromise between cost-reflectivity and perceived ‘fairness’ by shifting to a fixed network charge with no variable component. This would prevent rooftop solar owners from being able to receive outsized bill savings on their variable usage and therefore eliminate rooftop solar cross-subsidies. It would also prevent vulnerable consumers who have inflexible energy needs from being punished by high variable charges. Ron Ben-David has suggested basing the fixed charge on land or property value, as these are enhanced by connection to the network, while acknowledging that this is not a perfect solution.[136] Two properties of the same value may contribute vastly different levels of demand to the critical peak and therefore have differing levels of responsibility for network upgrade costs, reducing the tariff’s cost-reflectivity. This structure may also be perceived as unfair for renters who would be punished with higher bills if they live in an area with rapidly increasing property values. One solution could be to force landlords to pay the fixed network charge, but this would create further complexity given renters are almost always responsible for their electricity bills under the current system.[137] Opposition would also likely arise from retirees and pensioners on low incomes who have high-value properties, as this could cause a surge in their electricity bills that increases budget pressures.
9.4 Fixed charge only based on household income
The fourth option is to have a fixed network charge based on household income, with no variable component. Californian utilities are currently attempting to implement this structure.[138] It will eliminate solar cross-subsidies while ensuring vulnerable consumers are not punished with higher bills. Unsurprisingly, there has been substantial backlash from rooftop solar and home battery owners who would face bill increases as cross-subsidies are eliminated.[139] State lawmakers are currently attempting to thwart the utility company’s efforts to implement income-based fixed charges.[140] Although the Australian electricity system already involves income-based cross-subsidies in the form of hardship programs, increasing such cross-subsidies through an income-based fixed network charge may provoke similar opposition to that seen in California. There would be implementation challenges associated with consumers being required to disclose income to retailers.
Another issue with fixed network charges is they could theoretically cause an increase in total network upgrade costs, since consumers would not be rewarded for reducing their contribution to critical peak demand. However, the current network tariff structures do little to incentivise reductions in critical peak demand anyway due to their blunt price signals, so any increase will likely be negligible. Regardless, the total system savings from eliminating cross-subsidies and therefore discouraging rooftop solar installations above their efficient level would likely far outweigh any increase in upgrade costs — especially given increased rooftop solar penetration means more upgrades, not less, as explained in Section 5.2.
9.5 Fixed charge only with limited or unlimited peak demand options
The fifth option is to have a fixed network charge with a similar structure to a pre-paid mobile plan. Customers could pay a higher fixed rate to have unlimited usage during peak times, or they could opt for a plan with a lower fixed rate based on an agreed limit to their peak demand. The limit could apply either during daily peak periods or only on the few days a year in which critical peak periods are likely to occur, with customers receiving SMS notifications beforehand. Smart meters could be used to throttle electricity supply once the limit is reached and customers who decide they would prefer to pay more to lift the limit on a particular day could purchase add-on packages, similar to those offered in many pre-paid mobile plans. This would ensure a high level of cost-reflectivity, since customers able to have higher demand during critical peak periods will pay more and therefore pay a larger share of network upgrade costs. It would end solar cross-subsidies because solar customers would only receive bill savings if they commit to reducing their demand during a critical peak. However, this structure could face political opposition as it may be perceived as unfairly punishing those with inflexible energy demands by charging them more than those who can afford to be flexible.
9.6 Fixed charge based on residence size and type and household size
The sixth option is a fixed charge based on a proxy that includes the size and type of residence, and household size. This would involve DNSPs estimating the average contribution to network costs of different residence types (e.g., detached house, apartment), taking into account the influence of the number of bedrooms and/or the number of residents. This avoids the implementation challenges of basing variable charges on past contributions to critical peak demand in previous years, while providing a reasonably cost-reflective proxy on which to base a fixed charge. Taking into account the presence or absence of air conditioning units would also improve cost-reflectivity of this tariff structure. However, DNSPs do not currently collect any of these data from all their customers, which would increase the administrative burden. Relying on accurate reporting from customers with respect to air conditioning and number of residents would be difficult, particularly because some households have a highly variable number of residents. Using only residence type and number of bedrooms would allow DNSPs to use publicly available real estate data, rather than relying on accurate self-reporting from customers, increasing the feasibility of this option. There is a possibility that using the number of bedrooms could cause distortions to arise in the housing market in future as homeowners try to minimise the number of officially counted ‘bedrooms’ to reduce electricity costs. To avoid this, a simple fixed charge based only on residence type could be used. This would be less cost-reflective than other options but easier to implement and will completely eliminate rooftop solar cross-subsidies.
9.7 Striking the right balance
Ultimately, the difficulties of ending cross-subsidies by making network tariffs more ‘cost-reflective’ highlight the problems created by high penetrations of rooftop solar. Implementing a solution to end cross-subsidies by accurately reflecting real network price signals would mean rewarding consumers who can afford to be flexible and punishing those who cannot. It would mean asking consumers to serve the grid rather than the grid serving consumers – the latter being the core responsibility of the energy market bodies.
In an ideal world, cost-reflective network tariffs could be rolled out rapidly, with consumers responding to price signals in a way that minimises both system costs and opportunity costs for all. Consumers who wanted more flexibility would pay more than those willing to trade flexibility for lower prices. But we do not live in an ideal world and political backlash likely to arise in response to major reforms must be taken into account if reform efforts are to be successful. Even softer reforms such as demand tariffs introduced by SA Power Networks have already faced substantial backlash, being blocked by the Regulator and condemned as discrimination against solar customers by solar interest groups.[141] Sending strong price signals to consumers to be flexible in their demand could provoke significant backlash by causing substantial negative social impacts for those on low incomes with inflexible demand and could create significant opportunity costs for consumers who must rearrange their schedules to reduce peak demand. Cost-reflectivity must be balanced with the feasibility of implementing any proposed network tariff structure to ensure political backlash does not scuttle reform efforts entirely, allowing the current system with disastrously misaligned incentives to continue.
While each of the above structures has its benefits and challenges, all of them are likely to benefit consumers in the long run far more than the current network tariff structure which allows substantial cross-subsidies to solar customers. All things considered, a fixed charge with no variable component based on residence type is likely the most feasible option to implement as it eliminates rooftop solar cross-subsidies, is relatively easy to implement at an administrative level and avoids further market distortions. Radical network tariff reform is difficult but non-negotiable if vulnerable consumers and the stability of the grid are to be protected and electricity costs lowered.
10. Conclusion
For consumers and the grid, rooftop solar has become a paradise lost. Considering its intermittent, correlated and fragmented nature, this was inevitable. The underlying economics don’t stack up and they never will. Contrary to the promises of its advocates, rooftop solar only provides financial benefits if the investing consumer can receive a cross-subsidy from consumers without solar.
If cross-subsidies continue, DNSPs will have to keep increasing network tariffs to recoup costs from a shrinking volume of grid electricity consumption. But there is a limit to how high rates can climb — if they significantly exceed the cost of running a diesel generator, consumers who can afford to buy one will likely begin going off-grid in droves. This would not only worsen the situation for remaining consumers but would defeat the purpose of encouraging rooftop solar uptake to reduce emissions. It is unlikely governments would allow the situation to deteriorate to this point, which means taxpayers would be on the hook for even greater handouts than the current bill subsidies.
On the other hand, if cross-subsidies were ended through reforming network tariffs, consumers would soon learn the true value of rooftop solar; which would likely result in installation numbers dropping significantly.
Before encouraging broad-scale adoption of a technology that was always going to provide at best small and diminishing returns, energy bodies should have done the work to quantify the benefits of this technology and communicated this clearly to policymakers and the public. Now that rooftop solar is testing the limits of our energy grid due to such high rates of adoption, it is more vital than ever that energy bodies quantify the costs and benefits of continued direct subsidies and indirect cross-subsidies, including for batteries.
AEMO needs to not only quantify the benefits of coordinating batteries, but calculate exactly how much incentivising their uptake will cost the system. If we are to understand exactly how much incentives for batteries will cost for the benefits they provide, the ISP needs to co-optimise rooftop solar and home batteries alongside large-scale generation and storage. Policymakers need to be made aware of the costs of their policies to avoid energy bills and government expenditure on subsidies from spiralling out of control.
Most importantly, energy bodies and policymakers need to stop viewing consumers as energy producers. Very few consumers want to deal with energy plans of ever-increasing complexity as a result of de-centralised generation and storage — at present, solar and battery customers only tolerate increased complexity due to the substantial outsized bill savings they receive. The average Australian just wants the lights to come on when they flick the switch and their bills to be as low as possible — and, secondarily, to know that they are using a grid run on low-emissions energy sources. Instead of focusing on giving consumers more ‘options’ and information so they make the ‘right’ decision, energy bodies and policymakers need to remember that the most cost-effective way of producing clean and reliable energy is a grid that relies on large-scale, dispatchable generation.
There is still time to course-correct and stop throwing good money after bad, but it will require brave policymakers and a major change in the dominant narrative. Otherwise, the false paradise of rooftop solar promises even higher bills and an increasingly less equitable energy system.
11. Appendix: methodology
11.1 Payback period, 25-year ROI, and 25-year IRR for rooftop solar
The analysis on rooftop solar installations in Section 3 provides a detailed evaluation of the 25-year net return on investment (ROI) and payback periods for solar households at various points in time.
Historical installation, cost, and government rebates
The analysis draws on comprehensive historical small-scale renewables installation datasets from the Clean Energy Regulator.[142] These datasets include monthly records of installations aggregated by postcode, capturing system capacities (in kilowatts) and count of installations from 2001 to the present. A trailing 12-month average is applied to calculate typical system sizes, smoothing short-term fluctuations and identifying longer-term trends in average system size, which show an upward trend over time.
Installation costs are derived from the annual system prices for rooftop solar systems in the National Survey Report on PV Power Applications, published under the IEA Photovoltaic Power Systems Programme (IEA PVPS).[143] Figure 9 illustrates the price trend for rooftop solar systems up to 10 kW, excluding rebates. These annual prices are interpolated to generate monthly cost estimates in dollars per kilowatt and adjusted to include GST.
Government rebates — such as the Photovoltaic Rebate Program (PVRP), Solar Homes and Communities Plan (SHCP), and Small-scale Technology Certificates (STCs) — were incorporated into the modelling to account for reduced installation costs. For STC prices, we took the weighted average market price during each year and applied the Solar Credit multiplier when the scheme was active. This ensured that our modelling accurately reflected the evolving financial incentives available to rooftop solar adopters over time. The eligibility criteria, timelines, and financial caps of each scheme were carefully considered to reflect the actual cost savings for households (see Table 1 in Section 3).
Figure 9. Average system prices for rooftop solar.
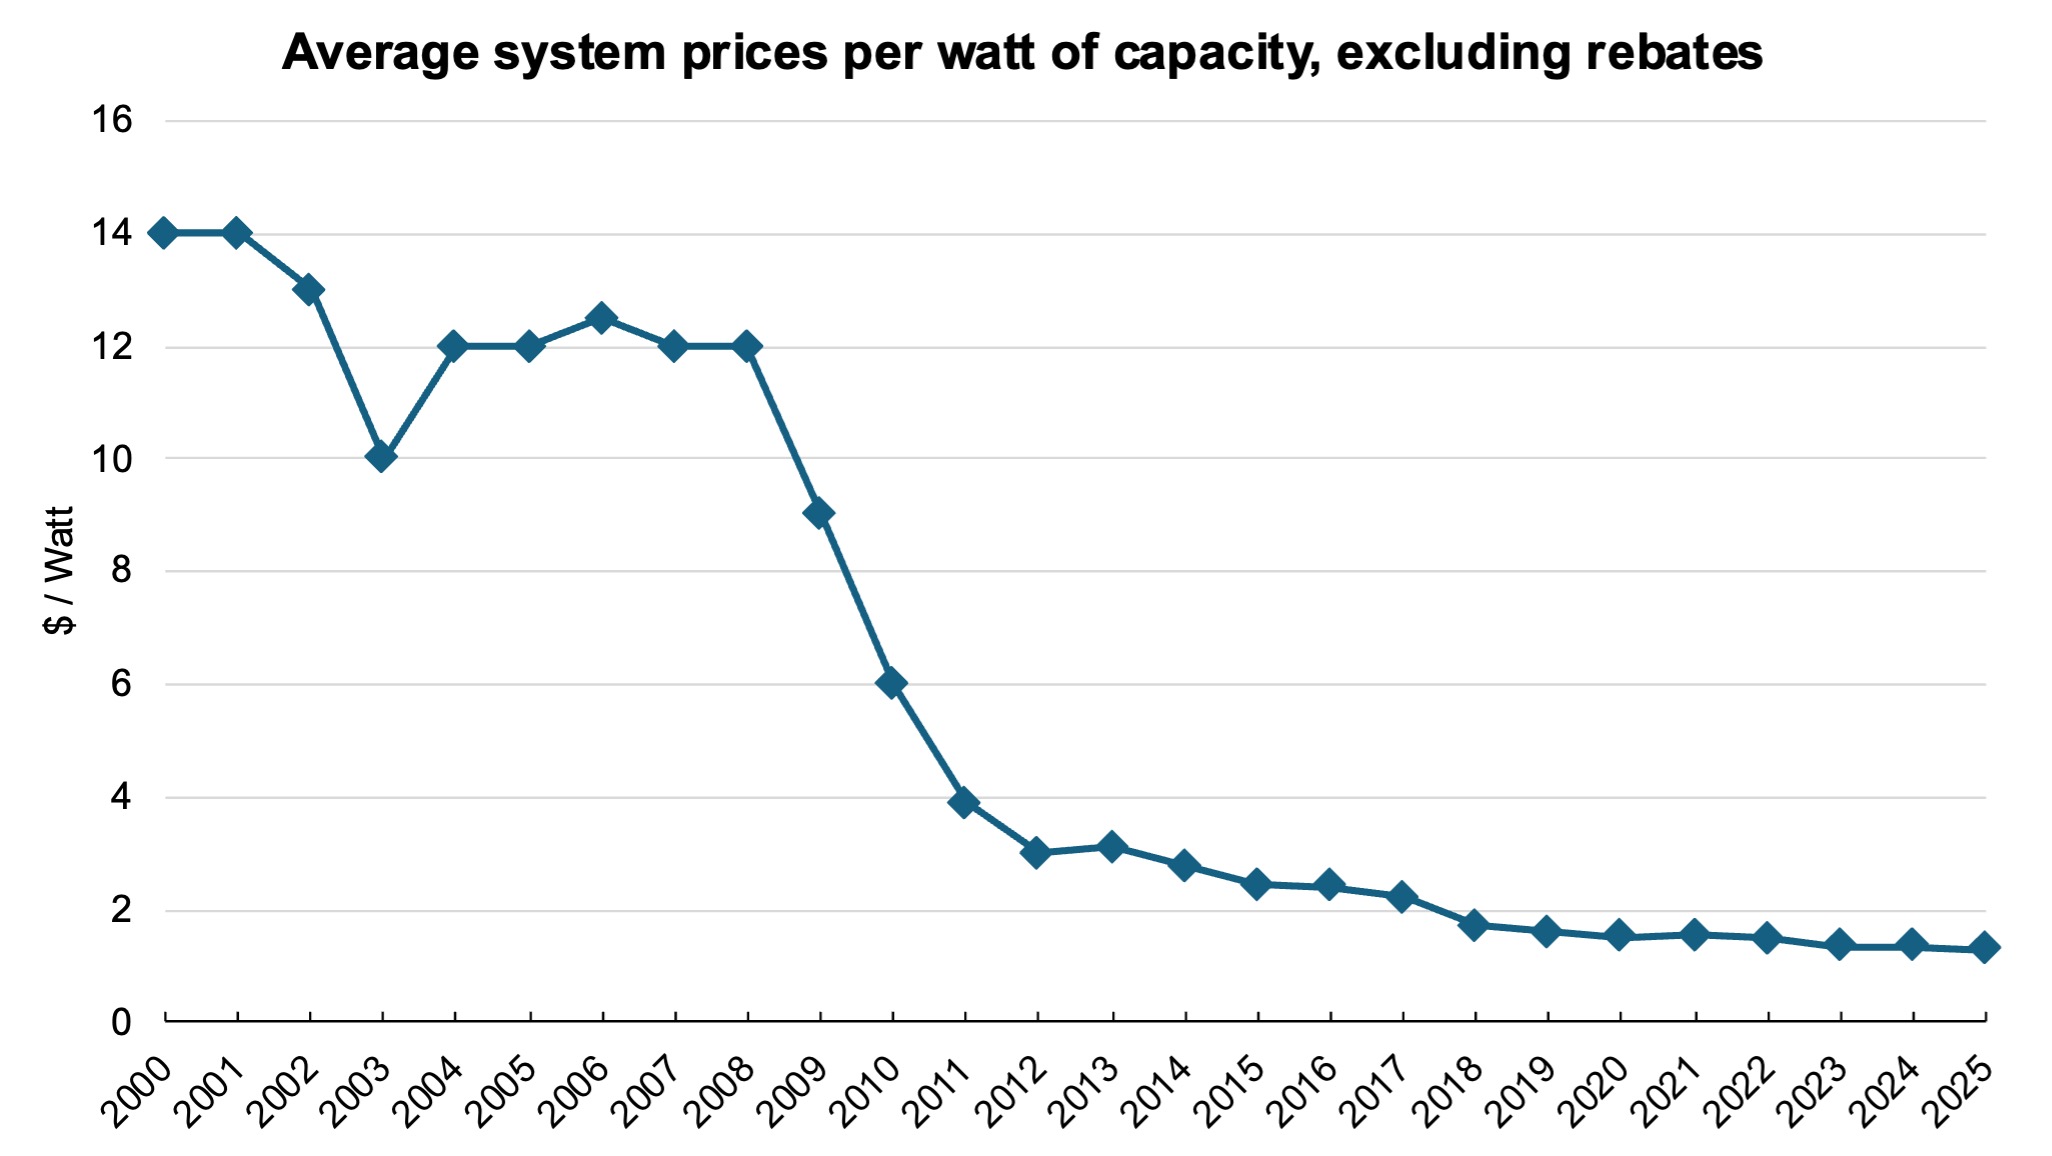
Solar production, export and bill savings
Solar production, export, and savings for each new installation are modelled on a monthly basis. The production estimates are derived from the average annual output of solar systems based on geographical areas. The Clean Energy Regulator defines four solar zones, each with an assumed annual output per kW of installed capacity. Postcodes are assigned to specific zones, and the weighted average output for NSW is calculated as 1.38 MWh per kW capacity per year, implying a capacity factor of 15.7% (see Table 4 in Section 11.3).[144]
Monthly solar production is calculated by applying the capacity factor to the monthly cohort’s typical system size, represented by the rolling annual average system size. This approach accounts for changes in the typical size of new installations over time. Export volumes are determined using export ratio data from SunWiz for various system sizes (see Section 11.3 for further details).[145] The difference between production and export represents the amount of solar energy that is self-consumed by the household.
Monthly savings are calculated by aggregating self-consumption savings and export revenue. Self-consumption savings are based on the portion of solar energy directly used by the household, valued at the prevailing electricity usage rates. For periods prior to June 2015, average electricity usage rates were sourced from IPART’s retail price data,[146] while usage rates for later periods were sourced from Vinnies’ tariff-tracking reports on solar market offers.[147]
Export revenue is derived from surplus solar generation exported to the grid, calculated using the applicable feed-in tariff rates. For systems installed under NSW’ Solar Bonus Scheme, gross feed-in tariff revenue is calculated based on the total electricity generated from the installation date up to the scheme’s closure and final payment on 31 December 2016. For systems installed outside the scheme, the analysis uses feed-in tariff data sourced from IPART, which monitors and benchmarks market rates. Specifically, the mid-point of IPART’s annual benchmark range for feed-in tariffs is applied to calculate export revenue in NSW.[148]
Payback period
The payback period represents the realised or expected timeframe required for a solar system installation to recover its initial cost through cumulative monthly savings. This is determined by identifying the point at which the cumulative savings — derived from avoided grid usage costs and export revenues — equal or exceed the installation cost after rebates.
For installations that have not achieved break-even by December 2024, the remaining cost is divided by the most recent monthly savings to estimate the additional time required to recover the investment. It is worth noting that in some cases, the payback period may exceed the typical 25- to 30-year lifespan of a rooftop solar system.
25-year return on investment (ROI)
The net savings over 25 years are calculated by subtracting the installation cost (after rebates) from the cumulative monthly savings. These net savings are then expressed as a net return on investment over the 25-year horizon using the following formula:
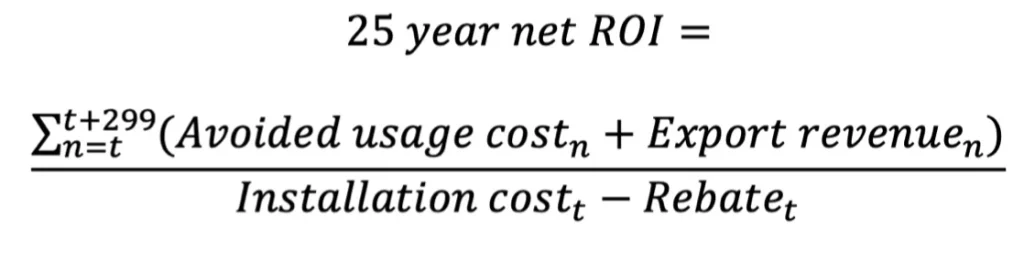
Where:
- t is the month of installation.
- n represents each month within the 25-year (300-month) horizon, starting from the installation month (t) and ending at t + 299.
Solar panels in Australia typically last 25 to 30 years. A 25-year horizon is chosen to provide a conservative estimate while offsetting the simplification of excluding panel degradation. Solar panel output typically decreases by 0.5% to 1.5% annually.[149] Assuming a 1% annual degradation, the total energy output over a 30-year solar panel lifespan would be equivalent to approximately 26.7 years of non-degraded output.
For most monthly installation cohorts, calculations are extended beyond December 2024 to complete the 25-year period. In these cases, the most recent monthly savings values are assumed to remain constant for the remainder of the calculation timeframe.
25-year internal rate of return (IRR)
The IRR represents the annualised rate of return at which the present value of a rooftop solar system’s expected lifetime bill savings equals the upfront installation cost, net of rebates. It accounts for the time value of money and provides a comparable measure of financial returns across different monthly rooftop solar installations. The IRR is calculated by solving for r in the following equation:
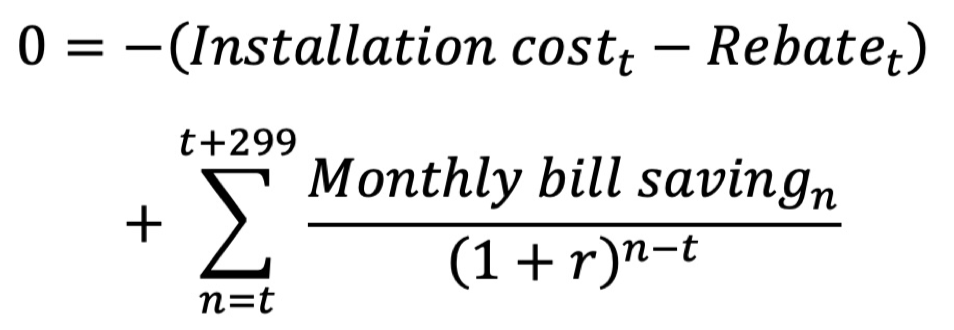
Where:
- t is the month of installation.
- n represents each month within the 25-year (300-month) horizon, starting from the installation month (t) and ending at t + 299.
- Monthly bill saving is the sum of avoided usage costs and export revenue for month n.
- r is the monthly discount rate, which is annualised as .
Most rooftop solar systems installed after 2000 will not complete their full 25-year lifespan by the end of 2024. For these cases, the latest observed monthly bill savings are assumed to remain constant for the remainder of the 25-year period to calculate the IRR.
11.2 System savings from rooftop solar
Averted expenditure was calculated using data on fuel costs under the ISP Step Change scenario and variable operating expenditure for existing plants from the 2024 ISP Inputs and Assumptions Workbook.[150] The weighted average of fuel costs and variable opex per unit of energy produced was calculated for each generation type (black coal, brown coal, OCGT, CCGT, gas-powered steam turbine, reciprocating engine, and waste coal mine gas), with weighting determined by nameplate capacity of individual generators. Fuel cost and variable opex data for reciprocating engine generation was used as an estimate for waste coal mine gas, as the latter did not have available data. Given waste coal mine gas represents 0.4% of annual generation, this approximation is unlikely to significantly change total cost estimates.
Total annual generation from July 2023 to August 2024 for each generation type was sourced from OpenNEM[151] and the contribution of each coal and gas generation type to annual coal and gas generation was calculated. The notional annual coal and gas generation displaced by rooftop solar was calculated by spreading rooftop solar generation proportionally over each coal and gas generation type according to each type’s contribution to the annual generation. New rooftop solar being added to the current system is primarily displacing coal during the day, as gas generation decreases to very low levels of output during peak solar hours compared to the smaller reduction in coal generation. This means our method likely overestimates the marginal savings provided by new rooftop solar systems, as black and brown coal is 4 to 22 times cheaper than gas generation depending on the type.
11.3 Outsized savings for NEM customers under current tariffs
Bill savings for 3 kW, 6 kW, and 9 kW solar systems in Section 6 are estimated for each state by calculating the solar production, export ratios, retail usage rates, feed-in tariffs, and fixed solar meter fees. The analysis calculates net savings per kilowatt-hour of solar production at the DNSP level, before aggregating to the state level using a weighted average based on the number of customers in each DNSP.
Solar production and export in each state
The solar production estimates are derived from data provided by the Clean Energy Regulator, which defines four solar zones across Australia, each with an assumed annual output per kW of installed capacity. The Clean Energy Regulator also provides postcode-level data of historical installations. Using this data, ACIL Allen calculated the weighted average annual output for each state, accounting for the distribution of installations across postcodes and zones.[152] These results are summarised in Table 4, which displays the percentage of rooftop solar installations in each solar zone by state and the corresponding weighted average annual solar output per kW.
Table 4. Percentage of rooftop solar installations in each solar zone by state with weighted average annual solar output per kW
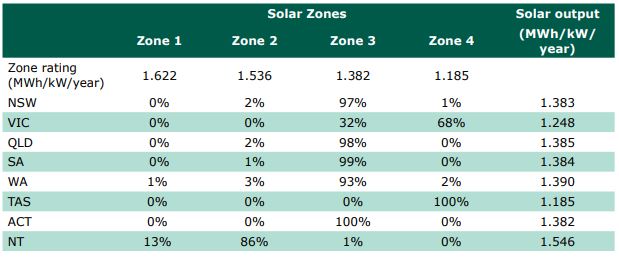
Export volumes are calculated using export ratio data from SunWiz for various system sizes. SunWiz surveyed 300 solar households to calculate export ratios — the percentage of solar energy exported to the grid rather than self-consumed — for each solar system size.[153] For 3 kW systems, we used the median export ratio directly from SunWiz. However, for 6 kW and 9 kW systems, where median export ratios were not published, we fitted an exponential curve to the available data points and extrapolated the export ratios for these system sizes. The calculated export ratios for various system sizes are shown in Figure 10.
Figure 10. SunWiz median export ratio data from 300 solar households with system sizes ranging from 1 to 5 kW and extrapolated median export ratios for 6 and 9kW systems.
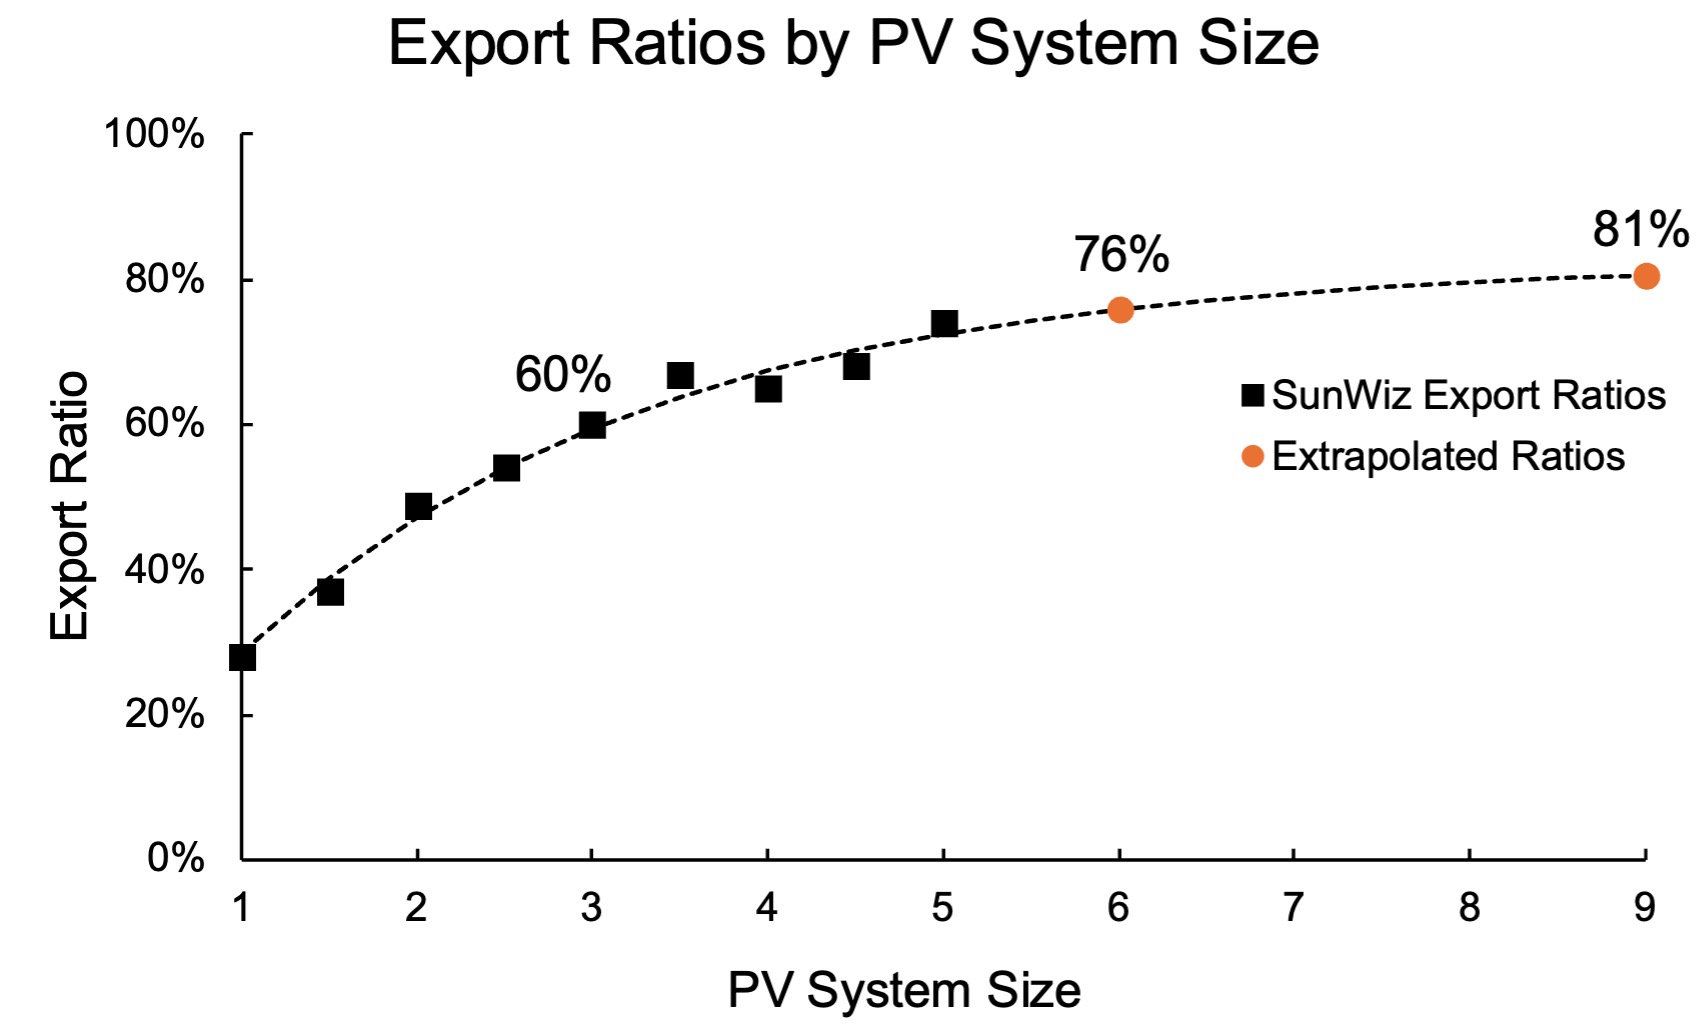
Retail tariffs: usage and feed-in tariff rates
Retail tariff data for each state was sourced from Vinnies’ Tariff-Tracking Reports, which compile solar market offers from retailers across the DNSPs in the National Electricity Market. The analysis focuses on single-rate and time-of-use tariffs, as demand tariff data was unavailable.[154]
For single-rate plans, some retailers employ block pricing structures, where the usage rate changes after a household exceeds a certain consumption threshold within a quarter. To address this variation, the analysis assumes the national average household electricity consumption of 5,383 kWh per year, equivalent to 1,346 kWh per quarter.[155] Using this assumption, an ‘effective’ usage rate is calculated by determining the weighted average of the block tariffs applied to typical quarterly consumption.
For time-of-use plans, the analysis relies on the shoulder rate as a proxy for the avoided usage tariff, due to the lack of granular hourly self-consumption data. The shoulder rate is selected because it largely coincides with periods of peak solar production, typically during the morning and early afternoon. However, in states like Tasmania and Victoria, where retail offers often include only peak and off-peak rates, the off-peak rate is assumed for self-consumption savings. This approach is conservative, as it does not account for the portion of self-consumption that occurs during peak periods, generally between 2 pm and 9 pm, when tariffs are significantly higher. As a result, the actual savings for time-of-use customers may be significantly underestimated.
Feed-in tariff rates, which determine the revenue earned from surplus solar energy exported to the grid, vary across retailers. If a retailer offers a single-tier feed-in tariff, the base rate is applied directly. For retailer plans with multiple tiers of feed-in tariff, an ‘effective’ feed-in tariff is calculated as a weighted average of the different tiers, based on the modelled quarterly export volumes for 3 kW, 6 kW, and 9 kW systems.
After determining the effective usage and feed-in tariff rates for each retailer plan, the median rates were calculated for each DNSP for subsequent analyses.
Bill savings calculation
Gross bill savings per kWh of solar production were calculated at the level of each DNSP. Specifically, gross savings were determined as the sum of export revenues—derived from the median feed-in tariff rate multiplied by the export ratio—and self-consumption savings, calculated as the median usage rate multiplied by the proportion of solar energy not exported to the grid. Mathematically, this is expressed as:
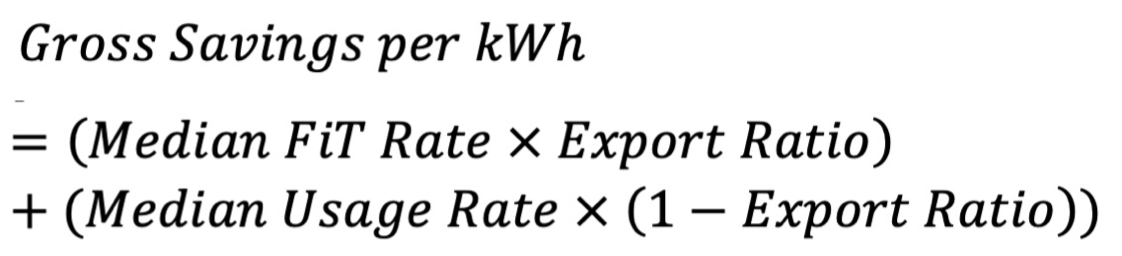
Some retailers also charge a fixed daily solar meter fee. To account for this, the solar meter fee is converted to a per-kWh basis by dividing the annual solar meter fee (calculated as the daily fee multiplied by 365.25 days to account for leap years) by the annual solar production for each system size. The net savings per kWh are then calculated by subtracting the per-kWh solar meter fee from the gross savings per kWh, as shown below:
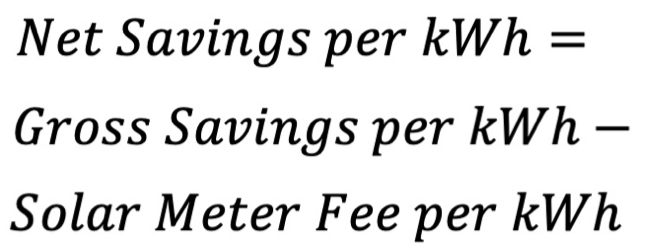
This calculation provides the bill savings per kWh of solar production at the DNSP level. To estimate savings at the state level, a weighted average is calculated. The net savings for each DNSP are weighted by the number of customers served by that DNSP within the state.[156]
11.4 Outsized savings for Ausgrid customers with and without export tariffs
Section 7.3 examines bill savings for solar customers in the Ausgrid distribution network before and after Ausgrid’s two‐way export tariff took effect. The analysis uses half‐hourly data from around 300 Ausgrid solar households over 2010–2012, allowing us to construct average hourly consumption and production profiles.[157]
Pre-implementation (standard feed-in tariff)
Under the conventional regime, we assume:
- Self-consumption of solar offsets either a single‐rate or a time‐of‐use (TOU) rate (depending on the household’s plan).
- Exported solar earns a feed‐in tariff (FiT) from the retailer.
We calculate self‐consumption savings by valuing each kWh of self‐used solar at the usage rate of the three largest retailers in the Ausgrid network: Origin, EnergyAustralia, and AGL. Export credits are then added at that retailer’s FiT rate. These calculations are performed for each retailer individually and then averaged to yield a representative estimate of pre‐implementation bill savings.
Post-implementation (two-way export tariff)
Ausgrid’s two‐way export tariff adds three major changes to how solar exports are valued:
- Off‐Peak or ‘Charge’ Export (10 am–3 pm): Exports up to a monthly free threshold pay no charge; exports above that threshold incur a 1.2 ¢/kWh charge.
- Peak or ‘Reward’ Export (4 pm–9 pm): All solar exports earn a 2.3 ¢/kWh reward.
- Shoulder or ‘Free’ Export: Exports outside the charge and reward periods are neither charged nor rewarded.
Each month includes a free export threshold, below which exports during the charge period (10 am–3 pm) are exempt from charges. This threshold varies by month, for example 212 kWh for a 31‐day month, 205 kWh for 30‐day months, and slightly lower for February.
Households are assumed to curtail their excess solar exports during off‐peak periods (10 am–3 pm) to avoid incurring charges. As a result, any exports exceeding the monthly free threshold during this period are excluded from total exported kWh in the analysis.
Consumption and Solar Profiles
The consumption profile was derived by calculating the average hourly consumption for each month across the three years. These monthly hourly profiles capture seasonal trends in household energy usage, reflecting variations in demand throughout the year.
The solar production profile was calculated by first normalising hourly solar generation per kilowatt of installed capacity to account for differences in system sizes across households. These normalised values were averaged over three years to create a monthly hourly production profile. The production profile is then scaled to represent typical solar output for 3 kW, 6 kW, and 9 kW systems across different months. By matching consumption to solar production hour by hour (Figure 11), we compute the self-consumption and solar export for each month and system sizes.
Figure 11. Monthly average household electricity consumption compared to modelled rooftop solar generation for 3 kW, 6 kW, and 9 kW systems
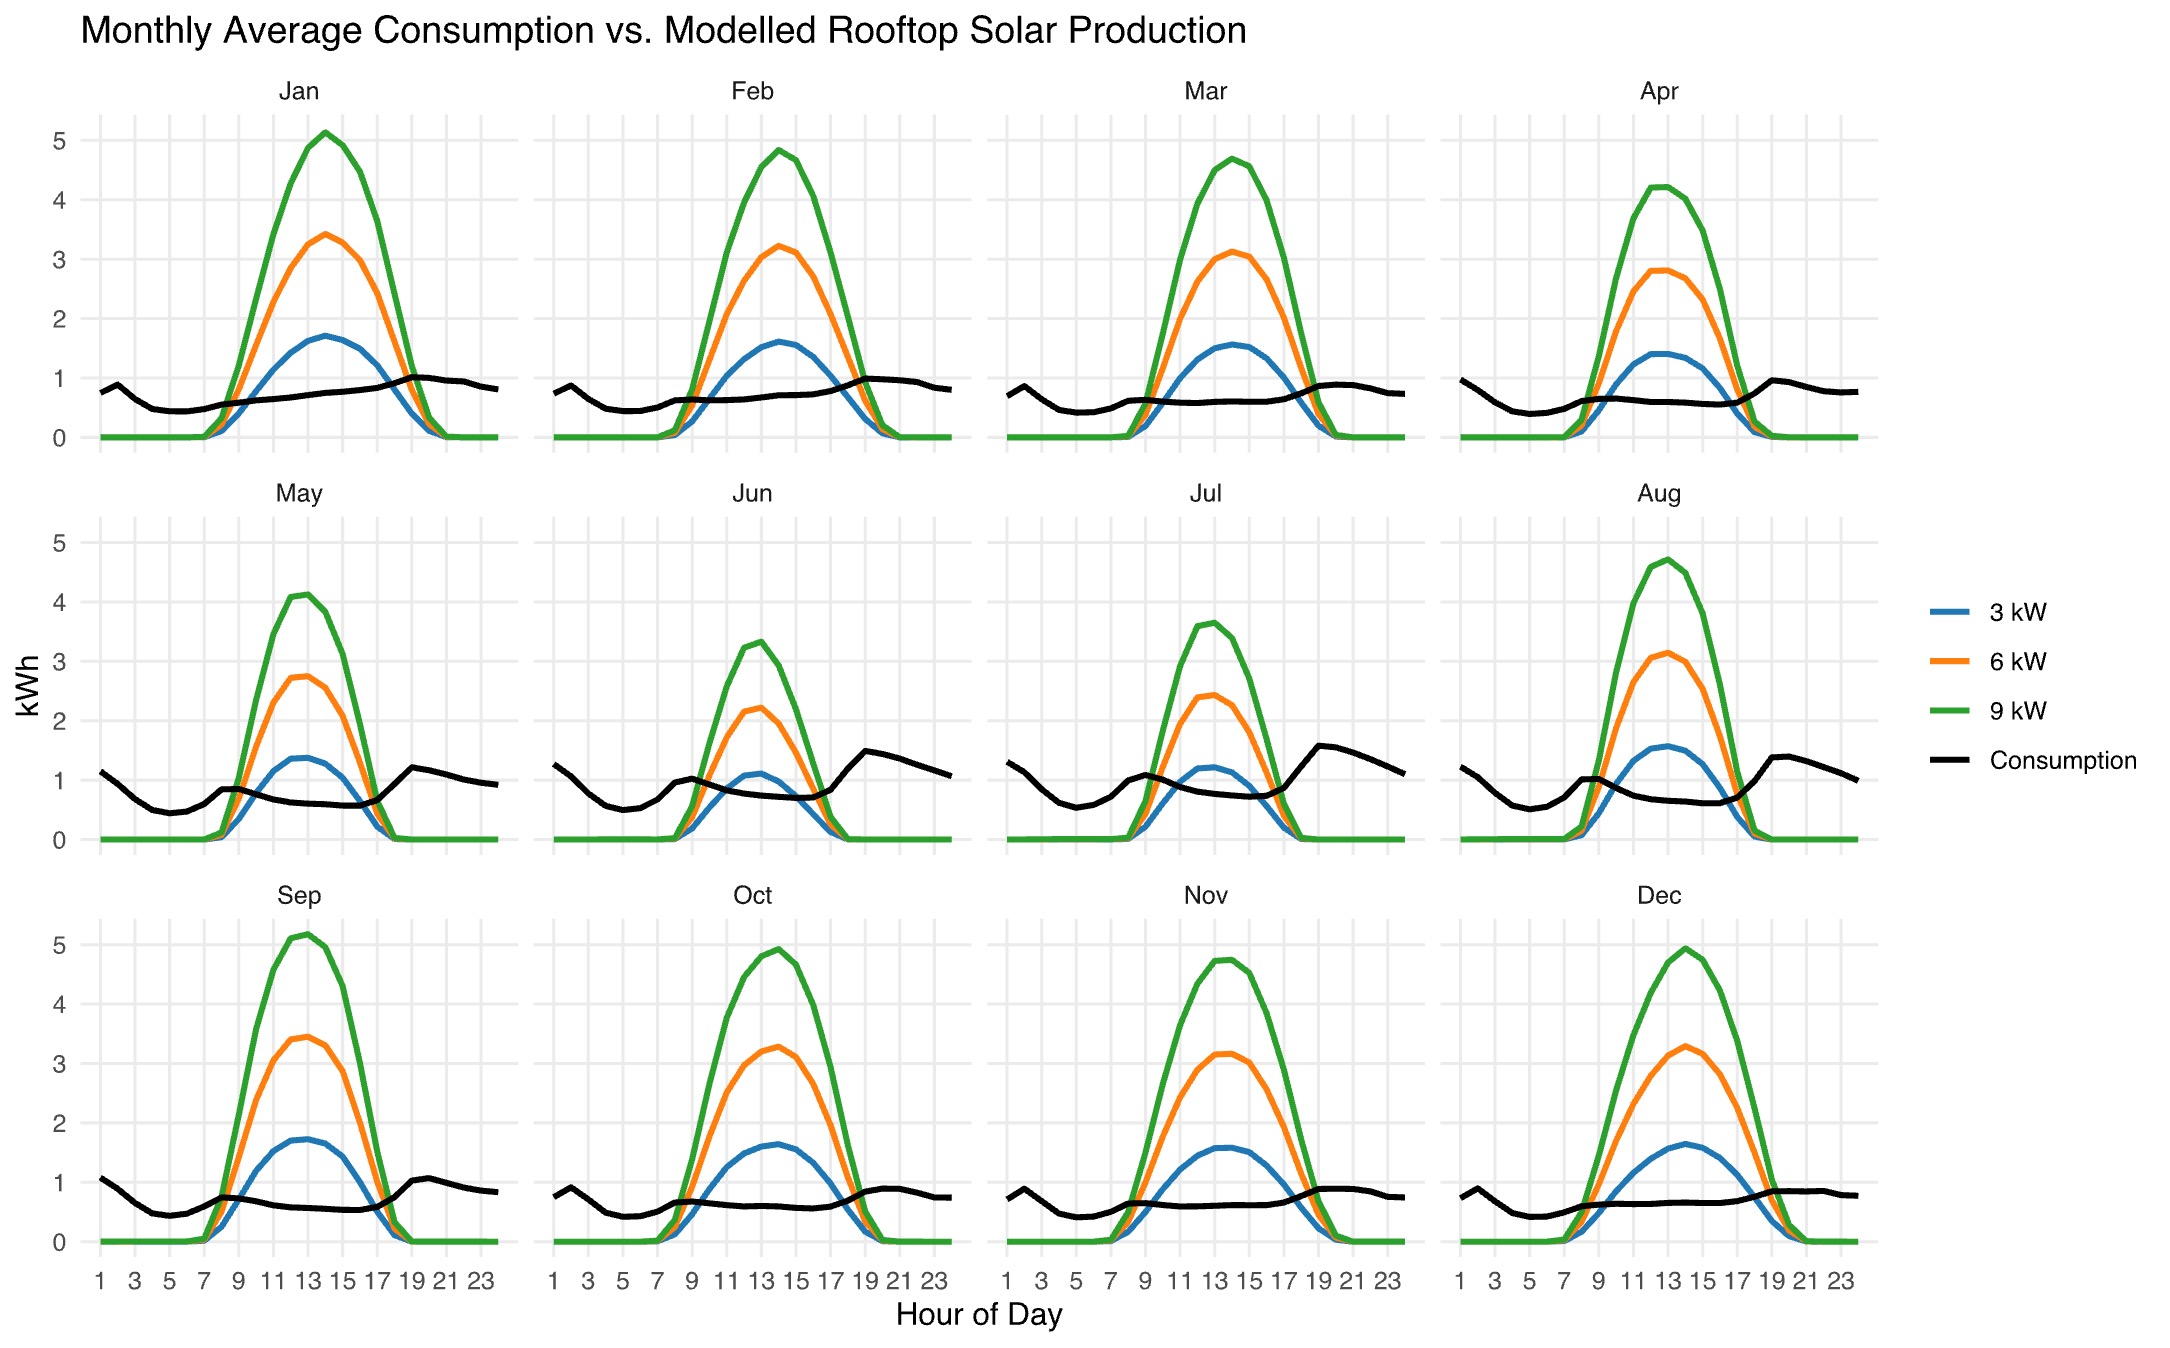
Bill savings and curtailment
Under the pre-implementation scenario, bill savings were calculated for each retailer by applying their specific tariff structures. Self-consumption savings were valued at the retailer’s time-of-use or single-rate tariff for each hour, while export revenue was credited at the retailer’s feed-in tariff rate. The calculations were performed for each retailer individually and then averaged to provide a representative estimate of bill savings across the Ausgrid network.
After the implementation of the two-way export tariff, the analysis adjusted the calculation of export savings to align with the new tariff structure. Exports during the reward period (4 pm–9 pm) were credited at the reward rate of 2.3 cents per kWh. Exports during periods without charges or rewards and those within the free threshold during the charge period were assumed to yield zero financial savings for households. Solar exports exceeding the free monthly threshold during the charge period were assumed to be curtailed, as households were expected to manage their exports to avoid incurring charges. This strategy of curtailing excess solar production during the charge period reduced the overall utilisation of solar energy.
Bill savings were calculated for each system size (3 kW, 6 kW, and 9 kW) and for both single-rate and time-of-use tariffs, evaluated on a per-kWh basis as well as in total annual terms. A value of 4 cents per kWh was assigned to the utilised solar production to reflect its contribution to the system. Since curtailed solar energy does not benefit any end user, it was excluded from the total production used in calculating system savings, bill savings per kWh, and total bill savings.
System sizes
Note that the system sizes in the Ausgrid sample were generally below 3 kW during the period. For this analysis, 3 kW, 6 kW, and 9 kW outputs are linearly extrapolated from the observed generation data, assuming unchanged household consumption. Although there is a modest correlation (R² ≈ 0.09) between system size and daily consumption in the dataset, we do not adjust consumption based on system size. In reality, larger homes with more roof space for larger solar installations tend to have higher usage, increasing per‐kWh savings from greater offset of usage charges — thus our results err on the conservative side.
Endnotes
[1] Bowen, Chris. 2024. “Australia’s rooftop solar revolution reaches astonishing new heights”. Commonwealth of Australia. https://minister.dcceew.gov.au/bowen/media-releases/australias-rooftop-solar-revolution-reaches-astonishing-new-heights.
[2] Prime Minister of Australia. 2023. “Opening of Sundrive Solar – Sydney”. https://www.pm.gov.au/media/opening-sundrive-solar-sydney.
[3] Minister for Energy and Climate Change & Minister for Environment and Heritage. 2024. “NSW Government update on hot weather”. NSW Government. https://www.nsw.gov.au/media-releases/nsw-government-update-on-hot-weather.
[4] AEMO. 2024. “Estimated payments and volumes for RERT activation on 27 November 2024”. https://aemo.com.au/-/media/files/electricity/nem/emergency_management/rert/2024/rert-activation-estimates-report-for-27-nov-2024.pdf?la=en.
[5] ABC. 2024. “AEMO says emergency powers to switch off solar needed in every state amid ‘system collapse’ fears”. https://www.abc.net.au/news/2024-12-02/aemo-demands-emergency-backstop-to-switch-off-solar/104670332.
[6] Albanese, Anthony. 2024. “Podcast – The Guardian Australian Politics”. https://www.pm.gov.au/media/podcast-guardian-australian-politics.
[7] Hansard, South Australian Legislative Council, 31 August 2023, p 3545.
[8] AEMO. 2024. “2024 Integrated System Plan”. p 17. https://aemo.com.au/-/media/files/major-publications/isp/2024/2024-integrated-system-plan-isp.pdf.
[9] Hilton, Zoe, Aidan Morrison, Alex Bainton & Michael Wu. 2024. “The six fundamental flaws underpinning the energy transition”. https://www.cis.org.au/publication/the-six-fundamental-flaws-underpinning-the-energy-transition/.
[10] AEMO. 2024. “2024 Integrated System Plan”. p 12. https://aemo.com.au/-/media/files/major-publications/isp/2024/2024-integrated-system-plan-isp.pdf?la=en.
[11] Select Committee on Energy Planning and Regulation in Australia. 2024. “Proof Committee Hansard Senate: Energy Planning and Regulation in Australia, Wednesday, 23 October 2024”. https://parlinfo.aph.gov.au/parlInfo/download/committees/commsen/28539/toc_pdf/Energy%20Planning%20and%20Regulation%20in%20Australia%20Select%20Committee_2024_10_23.pdf.
[12] Hilton, Zoe, Aidan Morrison, Alex Bainton & Michael Wu. 2024 “The six fundamental flaws underpinning the energy transition”. https://www.cis.org.au/publication/the-six-fundamental-flaws-underpinning-the-energy-transition/.
[13] AER. 2024. “Insights into Australia’s growing two-way energy system – Export services network performance report 2024”. p 8. https://www.aer.gov.au/documents/insights-australias-growing-two-way-energy-system-export-services-network-performance-report-2024.
[14] AER. 2024. “State of the energy market 2024”. p 290. https://www.aer.gov.au/system/files/2024-11/State%20of%20the%20energy%20market%202024.pdf.
[15] AER. 2024. “State of the energy market 2024”. p 294. https://www.aer.gov.au/system/files/2024-11/State%20of%20the%20energy%20market%202024.pdf.
[16] AEMC. 2024. “A Consumer-Focused Net Zero Energy System: The Australian Energy Market Commission’s vision for our shared energy future”. p 19. https://www.aemc.gov.au/sites/default/files/2024-10/AEMC_narrative_150824_v6%20%28002%29%20as%20of%2010%20October%202024.pdf.
[17] Collyer, Anna. 2024. “Beyond here, there be batteries”. AEMC. https://www.aemc.gov.au/news-centre/speeches/beyond-here-there-be-batteries.
[18] AEMC. 2024. “AEMC submission to the Inquiry into energy planning and regulation in Australia”. https://www.aph.gov.au/DocumentStore.ashx?id=fd0b7f25-0d75-402c-a6b1-71827b342751&subId=768457.
[19] AEMC. 2024. “AEMC Statement of Intent 2024”. https://www.aemc.gov.au/sites/default/files/2024-07/2024%20AEMC%20Statement%20of%20Intent%20-%20final.pdf.
[20] CSIRO. 2019. “Adoption of solar power – why or why not?” https://www.csiro.au/-/media/EF/Files/Energise-insights/Insight-56-Adoption-of-solar-power.pdf
[21] Newgate Research. 2021. “Community Attitudes to Rooftop Solar and the AEMC’s Proposed Reforms: Research Report”. Prepared for Energy Consumers Australia. https://energyconsumersaustralia.com.au/wp-content/uploads/Report-on-Community-Attitudes-to-Rooftop-Solar-and-the-AEMC-Proposed-Reforms..pdf.
[22] Ausgrid. 2017. p 36. “Household Solar Power and Battery Survey: Project Report”. https://www.ausgrid.com.au/-/media/Documents/Demand-Mgmt/DMIA-research/Household-Solar-Power-and-Battery-Survey_-Report.pdf
[23] Macintosh, Andrew & Deb Wilkinson. 2011. “Searching for public benefits in solar subsidies: A case study on the Australian government’s residential photovoltaic rebate program”. Energy Policy. https://www.sciencedirect.com/science/article/abs/pii/S030142151100187X.
[24] Commonwealth of Australia. 2012. “Renewable Energy (Electricity) Amendment Regulation 2012 (No. 8).” https://www.legislation.gov.au/Details/F2012L02419/Html/.
[25] NSW Government. 2014. “NSW Solar Bonus Scheme Statutory Review – Report to the Minister for Resources and Energy”. p 8. https://www.parliament.nsw.gov.au/tp/files/15731/Solar%20Bonus%20Scheme%20Review%202014.pdf
[26] The normal retailer feed-in tariffs reflect the midpoint of the all-day solar feed-in tariff benchmark range published by IPART each year. Source: IPART. 2025. “Solar Feed-in Tariff Price Guide”. https://www.ipart.nsw.gov.au/iparts-solar-feed-tariff-price-guide.
[27] Green Energy Markets. 2024. “Projections for distributed energy resources – solar PV and stationary energy battery systems”. p 29. https://aemo.com.au/-/media/files/major-publications/isp/2025/gem-2024-solar-pv-and-battery-projections-report.pdf?la=en
[28] Palm, Alvar. 2020. “Early adopters and their motives: Differences between earlier and later adopters of residential solar photovoltaics”. Renewable and Sustainable Energy Reviews. 133. 110142. https://www.sciencedirect.com/science/article/pii/S1364032120304330.
[29] Ibid.
[30] St Vincent de Paul Society. 2024. “NSW Energy Prices”. https://www.vinnies.org.au/national-council/advocacy/energy/energy-nsw.
[31] IPART. 2024. “Solar feed-in tariffs in NSW”. https://www.ipart.nsw.gov.au/solar-feed-tariffs-nsw-1.
[32] The Consumer Price Index (CPI) increased from 99.2 in 2011 June quarter to 139.4 in 2024 December quarter, which is an average annual inflation rate of 2.55%. Adjusting for inflation, the real IRR is .
[33] Oxford Economics Australia. 2024. “Discount Rates for Energy Infrastructure: Prepared for AEMO for the 2026 Integrated System Plan”. p 9. https://aemo.com.au/-/media/files/major-publications/isp/2025/oxford-economics-australia-2024-discount-rate-report.pdf?la=en.
[34] AER. 2024. “Seasonal peak demand – NEM”. https://www.aer.gov.au/industry/registers/charts/seasonal-peak-demand-nem; AER. 2023. “State of the Energy Market 2023”. p 53. https://www.aer.gov.au/system/files/2023-10/State%20of%20the%20energy%20market%202023%20-%20Full%20report_1.pdf.
[35] Parkinson, Giles. 2016. “How rooftop solar has dramatically shifted and reduced peak demand”. Renew Economy. https://reneweconomy.com.au/how-rooftop-solar-has-dramatically-shifted-and-reduced-peak-demand-66446/.
[36] Lawrence, Denis & John Kain. 2013. “Economic Benchmarking of Electricity Network Service Providers”. Economic Insights. Prepared for AER. p 12. https://www.aer.gov.au/system/files/Economic%20Insights%20report%20-%20Economic%20benchmarking%20of%20electricity%20network%20service%20providers%20-%2025%20June%202013.PDF.
[37] AEMC. 2013. “Fact sheet: What is reliability?” https://www.aemc.gov.au/sites/default/files/content/47372949-2b0b-4b4f-ba83-7469ef1b9bf5/Information-sheet-What-is-reliability.PDF.
[38] AEMO. 2024. “2024 Electricity Statement of Opportunities”. p 4. https://aemo.com.au/-/media/files/electricity/nem/planning_and_forecasting/nem_esoo/2024/2024-electricity-statement-of-opportunities.pdf.
[39] Lawrence, Denis & John Kain. 2013. “Economic Benchmarking of Electricity Network Service Providers”. Economic Insights. Prepared for AER. p iv. https://www.aer.gov.au/system/files/Economic%20Insights%20report%20-%20Economic%20benchmarking%20of%20electricity%20network%20service%20providers%20-%2025%20June%202013.PDF.
[40] Energex. 2023. “Distribution Annual Planning Report 2023-24 to 2027-28”. p 35. https://www.energex.com.au/__data/assets/pdf_file/0003/1167006/Distribution-Annual-Planning-Report-2023.pdf.
[41] Energex. 2023. “Distribution Annual Planning Report 2023-24 to 2027-28”. p 2. https://www.energex.com.au/__data/assets/pdf_file/0003/1167006/Distribution-Annual-Planning-Report-2023.pdf.
[42] Ergon Energy. 2023. “Distribution Annual Planning Report 2023”. p 34. https://www.ergon.com.au/__data/assets/pdf_file/0009/1167156/Distribution-Annual-Planning-Report-2023.pdf.
[43] Energex. 2023. “Distribution Annual Planning Report 2023-24 to 2027-28”. p 49. https://www.energex.com.au/__data/assets/pdf_file/0003/1167006/Distribution-Annual-Planning-Report-2023.pdf.
[44] Energex. 2023. “Distribution Annual Planning Report 2023-24 to 2027-28”. p 39, 43. https://www.energex.com.au/__data/assets/pdf_file/0003/1167006/Distribution-Annual-Planning-Report-2023.pdf.
[45] ARENA. 2022. “What is electricity grid inertia?” https://arena.gov.au/blog/what-is-electricity-grid-inertia/.
[46] Ergon Energy & Energex. 2024. “2024 Strategic Forecasting Annual Report”. p 20. https://www.energex.com.au/__data/assets/pdf_file/0019/1150246/Strategic-Forecasting-Annual-Report-2024.pdf.
[47] Fox, Jack. 2019. “Operational Forecasting in the NEM”. AEMO. https://www.linkedin.com/feed/update/urn:li:activity:6569528273326473216/
[48] Ergon Energy & Energex. 2024. “2024 Strategic Forecasting Annual Report”. p 2. https://www.energex.com.au/__data/assets/pdf_file/0019/1150246/Strategic-Forecasting-Annual-Report-2024.pdf.
[49] Energex. 2023. “Distribution Annual Planning Report 2023-24 to 2027-28”. p 40. https://www.energex.com.au/__data/assets/pdf_file/0003/1167006/Distribution-Annual-Planning-Report-2023.pdf.
[50] Ergon Energy & Energex. 2024. “2024 Strategic Forecasting Annual Report”. p 22. https://www.energex.com.au/__data/assets/pdf_file/0019/1150246/Strategic-Forecasting-Annual-Report-2024.pdf.
[51] The University of Melbourne. 2022. Transforming the grid for a renewables-based future. https://research.unimelb.edu.au/strengths/updates/news/transforming-the-grid-for-a-renewables-based-future.
[52] Ergon Energy. 2023. Distribution Annual Planning Report 2023. p 6. https://www.ergon.com.au/__data/assets/pdf_file/0009/1167156/Distribution-Annual-Planning-Report-2023.pdf.
[53] AER. 2023. State of the Energy Market 2023. p 53. https://www.aer.gov.au/system/files/2023-10/State%20of%20the%20energy%20market%202023%20-%20Full%20report_1.pdf.
[54] Sharma, Vanika, Syed Mahfuzul Aziz, Mohammed H. Haque & Travis Kauschke. 2020. “Effects of high solar photovoltaic penetration on distribution feeders and the economic impact”. Renewable and Sustainable Energy Reviews. 131. 110021. https://doi.org/10.1016/j.rser.2020.110021.
[55] OpenNEM. 2024. OpenNEM: South Australia. https://opennem.org.au/energy/sa1/?range=all&interval=1y&view=discrete-time.
[56] Sharma, Vanika, Syed Mahfuzul Aziz, Mohammed H. Haque & Travis Kauschke. 2020. “Effects of high solar photovoltaic penetration on distribution feeders and the economic impact”. Renewable and Sustainable Energy Reviews. 131. 110021. https://doi.org/10.1016/j.rser.2020.110021.
[57] Ross, Hannah. 2024. “Power surge costs Byron Bay households hundreds of thousands and insurance headaches”. ABC. https://www.abc.net.au/news/2024-08-06/power-surge-costs-some-households-hundreds-of-thousands/104174168.
[58] Ergon Energy. 2023. “Distribution Annual Planning Report 2023”. p 6. https://www.ergon.com.au/__data/assets/pdf_file/0009/1167156/Distribution-Annual-Planning-Report-2023.pdf; Energex. 2023. “Distribution Annual Planning Report 2023-24 to 2027-28”. p 7. https://www.energex.com.au/__data/assets/pdf_file/0003/1167006/Distribution-Annual-Planning-Report-2023.pdf.
[59] SA Power Networks. 2023. “Distribution Annual Planning Report 2023/24 to 2027/28”. p 3, 55. https://www.sapowernetworks.com.au/public/download.jsp?id=9716
[60] SA Power Networks. 2025. “Solar curtailment for minimum system demand events”. https://www.sapowernetworks.com.au/your-power/quality-reliability/solar-curtailment-for-minimum-system-demand-events/.
[61] Williamson, Rachel. 2024. “Solar industry irate as Victorians to bear cost of technology to switch off rooftop PV”. Renew Economy. https://reneweconomy.com.au/solar-industry-irate-as-victorians-to-bear-cost-of-technology-to-switch-off-rooftop-pv/.
[62] Mercer, Daniel. 2024. “Australia’s energy operator wants emergency powers to switch off rooftop solar. What does it mean for households?” https://www.abc.net.au/news/2024-12-07/rooftop-solar-emergency-powers-what-does-it-mean-for-households/104690380.
[63] Horowitz, Kelsey, Bryan Palmintier, Barry Mather & Paul Denholm. 2018. “Distribution system costs associated with the deployment of photovoltaic systems”. Renewable and Sustainable Energy Reviews. 90. 420-433. https://www.sciencedirect.com/science/article/abs/pii/S1364032118301734.
[64] William Nacmanson & Luis Ochoa. 2020. “Deliverable 5 ‘Cost Comparison Among Potential Solutions’”. Advanced Planning of PV-Rich Distribution Networks. The University of Melbourne. https://www.researchgate.net/publication/346853363_Deliverable_5_Cost_Comparison_Among_Potential_Solutions.
[65] Nacmanson, William & Luis (Nando) Ochoa. 2020. “Deliverable 5 ‘Cost Comparison Among Potential Solutions’.” Advanced Planning of PV-Rich Distribution Networks. The University of Melbourne. https://www.researchgate.net/publication/346853363_Deliverable_5_Cost_Comparison_Among_Potential_Solutions; Centre for Independent Studies. 2024. “Answer to Senator Canavan’s question taken on notice by the Centre for Independent Studies at a public hearing on 31 October 2024 regarding the cost of upgrading distribution networks to integrate rooftop solar and consumer energy resources.” https://www.aph.gov.au/DocumentStore.ashx?id=ba2a9a20-d8c3-4f12-b81b-fd342b8eaec0.
[66] Vorrath, Sophie. 2024. “Hidden cost of rooftop solar? Actually, networks spend next to nothing on managing exports”. One Step Off the Grid. https://onestepoffthegrid.com.au/hidden-cost-of-rooftop-solar-actually-networks-spend-next-to-nothing-on-managing-exports/?trk=feed_main-feed-card_feed-article-content.
[67] Simshauser, Paul. 2015. “Demand Tariffs: resolving rate instability and hidden subsidies”. AGL Applied Economic and Policy Research. Working Paper No.45 – Demand Tariffs. https://www.researchgate.net/publication/276415820_Demand_Tariffs_resolving_rate_instability_and_hidden_subsidies.
[68] NERA Economic Consulting. 2014. “Efficiency of Tariffs for Current and Emerging Technologies: A Report for the Australian Energy Market Commission”. p ii-iii. https://www.aemc.gov.au/sites/default/files/content/f501b892-e2e0-4318-a1d1-93ad011e02c7/NERA-Economic-Consulting-–-Current-and-emerging-technologies.PDF.
[69] AEMO. 2024. “2024 Integrated System Plan”. p 12. https://aemo.com.au/-/media/files/major-publications/isp/2024/2024-integrated-system-plan-isp.pdf?la=en.
[70] Barr, Robert. 2024. “Electric Power Consulting Submission on the 2024 Draft AEMO Integrated System Plan”. https://www.epc.com.au/wp-content/uploads/EPC-Submission-on-the-2024-Draft-ISP-20240216-Final.pdf.
[71] Energy Consumers Australia. 2024. “Cost-reflective network tariffs aren’t very cost-reflective”. p 6. https://energyconsumersaustralia.com.au/wp-content/uploads/report-cost-reflective-network-tariffs-arent-cost-reflective-3.pdf.
[72] AEMC. 2024. “Residential Electricity Price Trends 2024”. https://www.aemc.gov.au/sites/default/files/2024-11/Price%20Trends%202024%20Final%20Report.pdf.
[73] Simshauser, Paul. 2016. “Distribution network prices and solar PV: Resolving rate instability and wealth transfers through demand tariffs”. Energy Economics. https://www.sciencedirect.com/science/article/abs/pii/S0140988315003060.
[74] Mountain, Bruce & Kelly Burns. 2021. “Is rooftop solar a play-thing of the well-to-do? A critique of the argument and evidence”. Victoria Energy Policy Centre. https://vuir.vu.edu.au/42213/7/210802%20is%20rooftop%20solar%20a%20plaything%20of%20the%20rich_.pdf.
[75] ACCC. 2024. “Inquiry into the National Electricity Market”. pp 13, 43. https://www.accc.gov.au/system/files/accc-inquiry-national-electricity-market-report-june-2024.pdf.
[76] Roberts, Millie. 2024. “Higher income households across NSW increasingly struggling to stay on top of their energy bills”. ABC. https://www.abc.net.au/news/2024-07-01/nsw-energy-power-water-electricity-gas-bill-disconnection/104021372.
[77] Australian Institute of Health and Welfare. 2024. “Home ownership and housing tenure”. Australian Government. https://www.aihw.gov.au/reports/australias-welfare/home-ownership-and-housing-tenure.
[78] Ausgrid. 2017. “Household Solar Power and Battery Survey”. https://www.ausgrid.com.au/-/media/Documents/Demand-Mgmt/DMIA-research/Household-Solar-Power-and-Battery-Survey_-Report.pdf.
[79] Fuentes, Paul Marty Jordan, Kaveh Khalilpour & Alexey Voinov. 2024. “Solar energy surge: The socio-economic determinants of the photovoltaic systems growth in Australia”. Energy Research & Social Science. 116: 103695. https://www.sciencedirect.com/science/article/pii/S221462962400286X#bb0100.
[80] Ergon Energy. 2024. “Ergon Energy Network Revised Regulatory Proposal 2025-30”. https://www.aer.gov.au/system/files/2024-12/Ergon%20-%202025-30%20Revised%20Regulatory%20Proposal%20-%202%20December%202024%20-%20public.pdf; Energex. 2024. “Energex Revised Regulatory Proposal 2025-30”. https://www.aer.gov.au/system/files/2024-12/Energex%20-%202025-30%20Revised%20Regulatory%20Proposal%20-%202%20December%202024%20-%20public.pdf.
[81] AER. 2023. “Draft Decision TasNetworks Electricity Distribution Determination 2024 to 2029: Attachment 19 Tariff structure statement”. https://www.aer.gov.au/system/files/2023-10/AER%20-%20Draft%20Decision%20Attachment%2019%20-%20Tariff%20structure%20statement%20-%20TasNetworks%20-%202024-29%20Distribution%20revenue%20proposal%20-%20September%202023.pdf. AER. 2023. “Draft Decision Power and Water Corporation Electricity Distribution Determination 2024 to 2029: Attachment 19 Tariff structure statement”. https://www.aer.gov.au/system/files/2023-10/AER%20-%20Draft%20Decision%20Attachment%2019%20-%20Tariff%20structure%20statement%20-%20Power%20and%20Water%20Corporation%20-%202024-29%20Distribution%20revenue%20proposal%20-%20September%202023.pdf.
[82] AER. 2024. “Final Decision Evoenergy Electricity Distribution Determination 2024 to 2029: Attachment 19 Tariff structure statement”. https://www.aer.gov.au/system/files/2024-04/AER%20-%20Final%20Decision%20Attachment%2019%20-%20Tariff%20structure%20statement%20-%20Evoenergy%20-%202024–29%20%20Distribution%20revenue%20proposal%20-%20April%202024.pdf.
[83] Government of Western Australia. 2024. “Energy Buyback Schemes”. https://www.wa.gov.au/organisation/energy-policy-wa/energy-buyback-schemes.
[84] Essential Services Commission. 2024. “Minimum feed-in tariff review 2024-25”. https://www.esc.vic.gov.au/electricity-and-gas/prices-tariffs-and-benchmarks/minimum-feed-tariff/minimum-feed-tariff-review-2024-25; Essential Services Commission. 2025. “Minimum feed-in tariff review 2025-26”. https://www.esc.vic.gov.au/electricity-and-gas/prices-tariffs-and-benchmarks/minimum-feed-tariff/minimum-feed-tariff-review-2025-26.
[85] Endeavour Energy. 2023. Tariff Structure Explanatory Statement. 2024-29 Regulatory Control Period. p 5. https://www.endeavourenergy.com.au/__data/assets/pdf_file/0024/73473/endeavour_energy_Tariff-Structure-Explanatory-Statement_TSES_final_november_2023.pdf; 2024. Bloch, Michael. “Endeavour Energy’s New Two-Way And Free Solar Soak Tariffs”. Solar Quotes. https://www.solarquotes.com.au/blog/endeavour-solar-tariffs-mb2947/; Ausgrid. 2024. “Two-way pricing for grid exports.” https://www.ausgrid.com.au/-/media/Documents/Tariff/Solar-Factsheet-two-way-pricing-for-grid-exports.pdf; Essential Energy. 2024. “Electricity pricing and network tariffs”. https://www.essentialenergy.com.au/our-network/network-pricing-and-regulatory-reporting/timing-is-everything/electricity-pricing-and-network-tariffs; SA Power Networks. 2024. “Draft Decision SA Power Networks Electricity Distribution Determination 2025 to 2030”. https://www.aer.gov.au/system/files/2024-09/AER%20-%20Draft%20Decision%20Attachment%2019%20-%20Tariff%20structure%20statement%20-%20SA%20Power%20Networks%20-%202025-30%20Distribution%20revenue%20proposal%20-%20September%202024.pdf.
[86] Essential Energy. 2024. “Electricity pricing and network tariffs”. https://www.essentialenergy.com.au/our-network/network-pricing-and-regulatory-reporting/timing-is-everything/electricity-pricing-and-network-tariffs.
[87] Ausgrid. 2024. “Two-way pricing for grid exports.” https://www.ausgrid.com.au/-/media/Documents/Tariff/Solar-Factsheet-two-way-pricing-for-grid-exports.pdf.
[88] Beazley, Jordan. 2024. “Consumer groups criticise energy companies charging solar panel owners for exporting power”. The Guardian. https://www.theguardian.com/australia-news/article/2024/may/17/energy-companies-charging-nsw-solar-panel-owners-for-exporting-power-criticised-by-lobby-group.
[89] AEMO. 2024. “2024 Integrated System Plan”. p 12. https://aemo.com.au/-/media/files/major-publications/isp/2024/2024-integrated-system-plan-isp.pdf?la=en.
[90] CSIRO. “Small-scale solar PV and battery projections 2022”. p 33. https://publications.csiro.au/publications/publication/PIcsiro:EP2022-5296.
[91] Green Energy Markets. 2023. “Projections for distributed energy resources – solar PV and stationary energy battery systems”. p 18. https://www.aemo.com.au/-/media/files/stakeholder_consultation/consultations/nem-consultations/2023/2024-forecasting-assumptions-update-consultation-page/green-energy-markets—2023-consumer-energy-resources-projection-report.pdf.
[92] Albanese, Anthony. 2024. “Podcast – The Guardian Australian Politics”. https://www.pm.gov.au/media/podcast-guardian-australian-politics.
[93] Kaka, Mustafa & Russell Pendlebury. 2022. “Turning point for incentives to invest in residential batteries”. AEMC. https://www.aemc.gov.au/turning-point-incentives-invest-residential-batteries.
[94] Hendy, Nina. 2024. “Homeowners rush to buy batteries to avoid ‘sun tax’”. Australian Financial Review. https://www.afr.com/policy/energy-and-climate/homeowners-rush-to-buy-batteries-to-avoid-sun-tax-20240821-p5k447.
[95] The Sydney Morning Herald. 2024. “Why governments should subsidise household batteries to go with solar”. The Sydney Morning Herald. https://www.smh.com.au/national/nsw/why-governments-should-subsidise-household-batteries-to-go-with-solar-20240415-p5fjxc.html.
[96] AEMO. 2024. “2024 ISP – Step Change – Core”. https://aemo.com.au/-/media/files/major-publications/isp/2024/supporting-materials/2024-isp-generation-and-storage-outlook.zip.
[97] Barr, Robert. 2024. “Electric Power Consulting Submission on the 2024 Draft AEMO Integrated System Plan”. https://www.epc.com.au/wp-content/uploads/EPC-Submission-on-the-2024-Draft-ISP-20240216-Final.pdf.
[98] Green Energy Markets. 2023. “Projections for distributed energy resources – solar PV and stationary energy battery systems”. p 28. https://www.aemo.com.au/-/media/files/stakeholder_consultation/consultations/nem-consultations/2023/2024-forecasting-assumptions-update-consultation-page/green-energy-markets—2023-consumer-energy-resources-projection-report.pdf.
[99] Ibid, p 68.
[100] Ibid, p 40.
[101] Ibid, p 38, 68.
[102] Collyer, Anna. 2024. “Beyond here, there be batteries”. AEMC. https://www.aemc.gov.au/news-centre/speeches/beyond-here-there-be-batteries.
[103] Sykes, Jeff. 2024. “Solar Battery Costs: Solar Battery Price Index”. Solar Choice. https://www.solarchoice.net.au/solar-batteries/price/.
[104] Dennis, Julius. 2024. “Home owners push for battery subsidy as solar power benefits become ‘increasingly marginal’”. ABC. https://www.abc.net.au/news/2024-07-12/queensland-solar-battery-system-renewables-election/104084174.
[105] Select Committee on Energy Planning and Regulation in Australia. 2024. “Proof Committee Hansard Senate: Energy Planning and Regulation in Australia, Wednesday, 23 October 2024”. https://parlinfo.aph.gov.au/parlInfo/download/committees/commsen/28539/toc_pdf/Energy%20Planning%20and%20Regulation%20in%20Australia%20Select%20Committee_2024_10_23.pdf.
[106] AER. 2024. “Insights into Australia’s growing two-way energy system – Export services network performance report 2024”. p 8. https://www.aer.gov.au/documents/insights-australias-growing-two-way-energy-system-export-services-network-performance-report-2024.
[107] Collyer, Anna. 2024. “Beyond here, there be batteries”. AEMC. https://www.aemc.gov.au/news-centre/speeches/beyond-here-there-be-batteries.
[108] McClaren, Rory. 2022. “South Australian government axes Home Battery Scheme, saving money in state budget”. https://www.abc.net.au/news/2022-06-01/sa-government-axes-home-battery-scheme-started-under-liberals/101118202.
[109] Richardson, Tom. 2022. “’I’m glad we’re killing it’: Labor scraps renewable energy subsidy schemes.” InDaily. https://www.indaily.com.au/news/2022/06/01/im-glad-were-killing-it-labor-scraps-renewable-energy-subsidy-schemes.
[110] Brakels, Ronald. 2024. “SA Home Battery Scheme’s New Calculator Gives Dismal Results (If You Can Find It)”. Solar Quotes. https://www.solarquotes.com.au/blog/sa-home-battery-scheme-calculator/.
[111] Queensland Government. 2024. “Battery Booster rebate for householders”. https://www.qld.gov.au/housing/home-modifications-energy-savings/battery-booster-program.
[112] According to correspondence received by CIS from the Battery Booster Program Team: “The $16 million Battery Booster program was launched as a single round program on 12 February 2024. The program funding allowed the program to stay open for a limited period. As you noted in your enquiry, the Battery Booster program is now closed. No information has been published yet on the program outcomes.”
[113] Total customer numbers for 2023-24 were taken from https://www.aer.gov.au/documents/energex-2023-24-annual-reporting-rin-templates and https://www.aer.gov.au/documents/ergon-energy-2023-24-annual-reporting-rin-templates. The proportion of customers who exported in 2023-24, more than 99% being solar customers, was taken from https://www.aer.gov.au/publications/reports/performance/insights-australias-growing-two-way-energy-system and used to calculate the number of exporting solar customers.
[114] Victorian Auditor-General’s Office. 2021. “Delivering the Solar Homes Program”. https://www.audit.vic.gov.au/report/delivering-solar-homes-program.
[115] Solar Victoria. 2023. “New solar battery loans to help save on your energy bills”. https://www.solar.vic.gov.au/new-solar-battery-loans-help-save-your-energy-bills.
[116] State Government of Victoria. 2024. “Section 2: What incentives are available to Victorians for solar battery systems?” https://www.solar.vic.gov.au/solar-battery-buyers-guide/section-2-what-rebates-and-incentives-are-available-victorians-solar.
[117] Solar Victoria. 2024. “Solar Homes Program reporting”. https://www.solar.vic.gov.au/solar-homes-program-reporting.
[118] AER. 2024. “Insights into Australia’s growing two-way energy system – Export services network performance report 2024”. p 8. https://www.aer.gov.au/documents/insights-australias-growing-two-way-energy-system-export-services-network-performance-report-2024.
[119] Solar Victoria. 2025. “Solar panel (PV) rebate”. https://www.solar.vic.gov.au/solar-panel-rebate; Solar Victoria. 2024. “Solar Homes Program reporting”. https://www.solar.vic.gov.au/solar-homes-program-reporting.
[120] Victorian Auditor-General’s Office. 2021. “Delivering the Solar Homes Program”. https://www.audit.vic.gov.au/report/delivering-solar-homes-program.
[121] Department of State Growth. 2024. “Tasmania’s Energy Saver Loan Scheme”. https://www.recfit.tas.gov.au/grants_programs/energy_saver_loan_scheme.
[122] According to CIS Correspondence with Renewables Climate Change and Future Industries Tasmania, 196 battery storage installations were supported by the Energy Saver Loan Scheme from its inception in October 2022 to 9th January 2025.
[123] Total customer numbers for 2023-24 were taken from https://www.aer.gov.au/documents/tasnetworks-d-2023-24-economic-benchmarking-rin-templates. The proportion of customers who exported in 2023-24, more than 99% being solar customers, was taken from https://www.aer.gov.au/publications/reports/performance/insights-australias-growing-two-way-energy-system and used to calculate the number of exporting solar customers.
[124] NSW Government. 2024. “Incentives for residential batteries”. https://www.energy.nsw.gov.au/households/rebates-grants-and-schemes/household-energy-saving-upgrades/residential-battery-incentives.
[125] Blunomy. 2023. “Distributed energy resource forecasts for Energex & Ergon Energy Network”. p 39. https://www.aer.gov.au/system/files/2024-02/Energex%20-%204.03%20-%20Blunomy%20Distributed%20Energy%20Resource%20Forecasts%20-%20May%202023.pdf.
[126] AEMO. 2023. “Consultation summary report – Update to the ISP Methodology”. p 35-38. https://aemo.com.au/-/media/files/stakeholder_consultation/consultations/nem-consultations/2023/isp-methodology-2023/consultation-summary-report—update-to-the-isp-methodology.pdf.
[127] Ergon Energy & Energex. 2024. “2024 Strategic Forecasting Annual Report”. p 6. https://www.energex.com.au/__data/assets/pdf_file/0019/1150246/Strategic-Forecasting-Annual-Report-2024.pdf.
[128] Australian Energy Regulator. 2024. “Network tariff reform”. https://www.aer.gov.au/about/strategic-initiatives/network-tariff-reform.
[129] ACCC. 2024. “Inquiry into the National Electricity Market”. p 4. https://www.accc.gov.au/system/files/accc-inquiry-national-electricity-market-report-june-2024.pdf.
[130] AEMC. 2025. “Spot and contract markets”. https://www.aemc.gov.au/energy-system/electricity/electricity-market/spot-and-contract-markets.
[131] Ausgrid. 2024. “An introduction to demand tariffs”. https://www.ausgrid.com.au/Your-Energy-Use/Understanding-Network-Tariffs/An-introduction-to-Demand-Tariffs.
[132] Energy Consumers Australia. 2024. “Cost-reflective network tariffs aren’t very cost-reflective”. p 4. https://energyconsumersaustralia.com.au/wp-content/uploads/report-cost-reflective-network-tariffs-arent-cost-reflective-3.pdf.
[133] Mercer, Daniel & Wiriya Sati. 2024. “Energy retailers’ ‘insidious’ power pricing charges households based on highest point of use”. ABC. https://www.abc.net.au/news/2024-06-03/demand-power-tariffs-shock-to-australian-households/103913030.
[134] AusNet. 2024. “GoodGrid”. https://www.ausnetservices.com.au/Electricity/GoodGrid.
[135] Mercer, Daniel & Wiriya Sati. 2024. “Energy retailers’ ‘insidious’ power pricing charges households based on highest point of use”. ABC. https://www.abc.net.au/news/2024-06-03/demand-power-tariffs-shock-to-australian-households/103913030.
[136] Ben-David, Ron. 2024. “What if the consumer energy market were based on reality rather than assumptions?” p 56-57. https://www.monash.edu/__data/assets/pdf_file/0007/3733441/Ron-Ben-David-What-if-the-consumer-energy-market-were-based-on-reality-rather-than-assumptions-July-2024.pdf.
[137] Ibid, p 57.
[138] Ibid, p 56-57.
[139] Solar.com. 2024. “Should CA Solar Owners Be Worried About Income Based Electricity Bills?” https://www.solar.com/learn/income-graduated-fixed-charges/.
[140] Ibid.
[141] Vorrath, Sophie. 2015. “SA Power Networks fights to charge solar homes $100/y more for the grid”. Renew Economy. https://reneweconomy.com.au/sa-power-networks-fights-to-charge-solar-homes-100y-more-for-the-grid-95539/.
[142] Clean Energy Regulator. 2025. “Small-scale installation postcode data”. https://cer.gov.au/markets/reports-and-data/small-scale-installation-postcode-data
[143] IEA PVPS. 2023. “National Survey Report of PV Power Applications in Australia”. https://iea-pvps.org/national-survey-reports/?year_p&country=47. The study utilised annual prices for rooftop solar systems up to 10kW from the report. For system costs in 2024 and 2025, the series was extended using the Solar Choice Price Index (www.solarchoice.net.au/solar-panels/solar-power-system-prices) by applying the year-on-year percentage change to the 2023 price.
[144] ACIL Allen. 2023. “Small scale technology certificate projections 2024-2028”. Report to The Clean Energy Regulator. p 4. https://cer.gov.au/document/small-scale-technology-certificate-projections-report-acil-allen-november-2023. The 1.38 MWh represents a weighted average, where the weights correspond to the number of solar installations across the different zones within NSW.
[145] Johnston, Warwick. 2015. “Solar pays its way on networks. It’s no free rider”. SunWiz. https://www.sunwiz.com.au/solar-pays-its-way-on-networks-its-no-free-rider/.
[146] IPART. 2023. “Changes in retail prices over time”. https://www.ipart.nsw.gov.au/changes-retail-prices-over-time.
[147] St Vincent de Paul Society. 2024. “NSW Energy Prices”. https://www.vinnies.org.au/national-council/advocacy/energy/energy-nsw.
[148] IPART. 2024. “Solar feed-in tariffs in NSW”. https://www.ipart.nsw.gov.au/solar-feed-tariffs-nsw-1.
[149] Dhimish M, Alrashidi A. 2020. “Photovoltaic Degradation Rate Affected by Different Weather Conditions: A Case Study Based on PV Systems in the UK and Australia.” Electronics. 9(4):650. https://doi.org/10.3390/electronics9040650; CSIRO. 2024. Projections for Solar PV and Battery Systems: Small-scale Solar PV and Battery Projections 2024. https://aemo.com.au/-/media/files/major-publications/isp/2025/CSIRO-2024-Solar-PV-and-Battery-Projections-Report.pdf; Green Energy Markets. 2024. Projections for Distributed Energy Resources – Solar PV and Stationary Energy Battery Systems. https://aemo.com.au/-/media/files/major-publications/isp/2025/GEM-2024-Solar-PV-and-Battery-Projections-Report.pdf.
[150] AEMO. 2024. “2024 ISP Inputs and Assumptions Workbook”. https://aemo.com.au/-/media/files/major-publications/isp/2024/2024-isp-inputs-and-assumptions-workbook.xlsx?la=en.
[151] OpenElectricity. 2024. “OpenNEM”. https://explore.openelectricity.org.au/energy/nem/.
[152] ACIL Allen. 2023. “Small scale technology certificate projections 2024-2028”. Report to The Clean Energy Regulator. p 4. https://cer.gov.au/document/small-scale-technology-certificate-projections-report-acil-allen-november-2023.
[153] Johnston, Warwick. 2015. “Solar pays its way on networks. It’s no free rider”. SunWiz. https://www.sunwiz.com.au/solar-pays-its-way-on-networks-its-no-free-rider/.
[154] St Vincent de Paul Society. 2024. “Vinnies tracking cost changes”. https://www.vinnies.org.au/advocacy/energy/tariff-tracking. Data was taken from July 2024 Solar Market Offers from retailers in every NEM state, except for Victoria for which only July 2023 data was available.
[155] Frontier Economics. 2020. “Residential energy consumption benchmarks”. p 24. https://www.aer.gov.au/system/files/Residential%20energy%20consumption%20benchmarks%20-%209%20December%202020_0.pdf. This report provided the latest electricity consumption benchmarks as of 2020, which the AER was previously required to update every three years. In August 2023, the Australian Energy Market Commission (AEMC) removed the obligation for the AER to develop or update these benchmarks. For this analysis, we calculated the national average consumption by weighting the average consumption in each distribution network service provider (DNSP) area according to DNSP-specific customer numbers for 2023–24.
[156] Customer numbers were collated from RIN data supplied to the AER from Evoenergy (https://www.aer.gov.au/documents/evoenergy-2023-24-annual-reporting-rin-templates), Ausgrid (https://www.aer.gov.au/documents/ausgrid-2023-24-annual-reporting-rin-templates), Endeavour Energy (https://www.aer.gov.au/documents/endeavour-energy-2023-24-annual-reporting-rin-templates), Essential Energy (https://www.aer.gov.au/documents/essential-energy-2023-24-annual-reporting-rin-templates), TasNetworks (https://www.aer.gov.au/documents/tasnetworks-d-2023-24-economic-benchmarking-rin-templates), AusNet (https://www.aer.gov.au/documents/ausnet-services-d-2023-24-annual-reporting-rin-templates), CitiPower (https://www.aer.gov.au/documents/citipower-2023-24-annual-reporting-rin-templates), Jemena Electricity (https://www.aer.gov.au/documents/jemena-2023-24-annual-reporting-rin-templates), Powercor Australia (https://www.aer.gov.au/documents/powercor-2023-24-annual-reporting-rin-templates), United Energy (https://www.aer.gov.au/documents/united-energy-2023-24-annual-reporting-rin-templates), Energex (https://www.aer.gov.au/documents/energex-2023-24-annual-reporting-rin-templates), Ergon Energy (https://www.aer.gov.au/documents/ergon-energy-2023-24-annual-reporting-rin-templates) and SA Power Networks (https://www.aer.gov.au/documents/sa-power-networks-2023-24-annual-reporting-rin-templates).
[157] Ausgrid. 2020. “Solar Home Electricity Data”. https://data.nsw.gov.au/data/dataset/solar-home-electricty-data/resource/d2dc76f0-22e3-4efc-bed9-bb4e0e50f0db.