Executive summary
The Australian Government wants to transition our electricity system to net zero carbon emissions by relying on wind and solar power – excluding alternatives such as small nuclear reactors. Its justification for this switch rests on the claim that a renewables-dominated system is environmentally beneficial and economically superior to using fossil fuels and nuclear energy.
But its premise is based on a flawed argument which has left out key elements which portray a different picture.
Energy Minister Chris Bowen, policymakers and other public figures use the CSIRO’s GenCost report and the Australian Energy Market Operator’s (AEMO) Integrated System Plan (ISP) to support their argument. These reports defend a belief of economic superiority for renewable energy which relies on two distinct claims:
- That renewable energy is cheaper than alternatives, including fossil fuels, regardless of any cost of carbon or other policy constraints; and
- That the planned transition is the cheapest pathway to reach Australia’s emission reduction targets.
The first claim is principally supported by GenCost, and the second by the ISP, though these claims are frequently conflated in policy discussions. However, the Centre for Independent Studies (CIS) has identified many critical flaws in the analysis of both reports that destroy any credible support they could give to these claims.
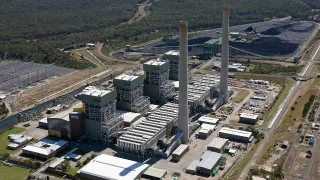
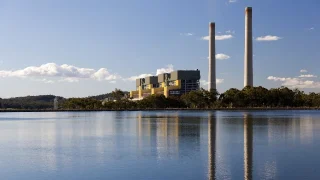
CIS research has found that using coal-fired generation for the majority of baseload demand, which Australia is dismantling, would be significantly cheaper in the near term than relying on intermittent renewables for 90% or more of energy generated, as the ISP and GenCost do. CIS has also found that GenCost overstates the cost of nuclear plants because it does not consider cost-effective and established models.
Second, CIS found the ISP has been undermined in its aim to develop the lowest-cost system by finding the optimal combination of infrastructure across states. State and Federal governments ‘declare’ projects to be required, without a comprehensive system-wide business case. The ISP then treats these projects as ‘sunk’ and forces the system to optimise around them, increasing costs. If the most inexpensive system was built — even relying almost entirely on renewables — it would likely look markedly different to the system being built. In particular, it would exclude very deep, pumped-hydro storage (e.g. Snowy 2.0) and the rapid advancement of high-voltage, interstate transmission which is underway.
This paper focuses on the question of how Australians have been led to believe two false claims: that renewables are the cheapest and that the cheapest version of a renewables-dominated system is to be built.
To answer this question, CIS has categorised the flaws in GenCost and the ISP under six headings. These flaws are misleading about the true costs of the proposed energy transition.
The six fundamental flaws of GenCost and the ISP are:
1 – Out-scoping costs
GenCost excludes storage and transmission costs incurred before 2030, making wind and solar appear cheaper than coal, gas and nuclear, even with high wind and solar penetration;
The ISP relies on rooftop solar and home batteries to provide generation and storage but excludes their costs from the model;
The ISP excludes the cost of recycling wind turbines, solar panels and batteries, making renewables appear cheaper than they are over their lifetime.
2 – Out-scoping carbon
The ISP excludes emissions from the manufacture of wind, solar and batteries making them seem cleaner. This restriction of ‘Scope 1’ emissions means the ISP will increasingly export emissions to China, whilst creating the appearance of meeting net zero ambitions locally.
3 – ‘Match-fixing’ the energy transition
The ISP claims a renewables-dominated grid is the cheapest option for Australia’s energy system without comparing any alternative, effectively fixing the outcome from the beginning, as the only baseline scenario without a binding renewable energy or carbon target has been removed;
The ISP manipulated the selection of inputs to force a faster timeline for transmission projects.
4 – Overfitting the model
The ISP has an overfit model that assumes favourable weather decades in advance and builds flexible gas capacity to compensate for years predicted to have poor weather for renewables. In reality, the grid will have to be prepared for almost any weather, every year, requiring greater investment to ensure reliability.
5 – Disintegrating the integrated system
The ISP method for determining the value of individual projects does not treat the energy system as an integrated whole (i.e. a system of smaller sub-systems) but rather a collection of parts largely independent of one another, allowing uneconomic projects to be approved and costs passed onto consumers;
The ISP treats government-committed projects with costs yet to be finalised as determined and does not assess their benefits making transmission projects that link these assets seem more valuable.
6 – Cherry-picking data
GenCost cherry-picks a single, overestimated data point from a cancelled project to use as the cost estimate for Small Modular Reactors (SMR) and does not include any data from large-scale, nuclear plants — making nuclear energy seem more expensive;
GenCost cherry-picks coal and gas price estimates so that fuel price spikes induced by the Ukraine war are locked in for the lifetime of new coal and gas plants;
GenCost uses unrealistic assumptions about construction costs for new coal plants, reinforcing the illusion they are more expensive than renewables;
The ISP chooses certain future years in which transmission projects show greater cost benefits, then justifies projects going ahead as soon as possible in an entirely different year;
The ISP selects years in its reliability analysis in which no reliability breaches occur and ignores years when a breach is likely to occur.
Introduction
Weather-dependent renewables have been consistently promoted by the Albanese government as the only option for Australians to have cheap, reliable and clean energy. Any attempts to question this or suggest an alternative technology have been denounced as climate denialism,[1] fossil fuel lobbying[2] or culture-war distraction.[3] This has affected the public policy debate around the relative costs and benefits of renewable energy.
This paper contends the declining quality of the energy debate can be traced to a growing rift between what policymakers and public figures claim the evidence supports and what the evidence actually supports.
On the first question of the energy trilemma — whether an energy system dominated by wind and solar is more environmentally friendly or ‘clean’ — there are clear grounds for debate. When only carbon emissions are considered, there is compelling evidence that wind and solar have significantly lower emissions per unit of electricity produced than coal.
But the environmental argument should also consider other factors, such as preserving the local natural environment. Land-intensive energy sources (e.g. wind and solar) will perform worse in this regard than technologies with a smaller footprint (e.g. coal and nuclear).
The second part of the trilemma is reliability. This is possible for a wind and solar-dominated grid, but not without great cost. Adding additional systems (e.g. extra transmission) sufficient to ensure reliability may also have an environmental impact.
The third part of the energy trilemma is cost. Energy Minister Chris Bowen[4] and other public figures[5] have claimed a renewables-dominated energy system — even including the costs of the transmission, storage and firming generation required to make it reliable — is still cheaper than the current coal-dominated system.
This claim, which is the foundation of current policy and has benefited from substantial affirmation in the media, appears to hold broad support from a large body of evidence. However, on close inspection, CIS has found there is essentially no credible evidence to support this claim.
Mr Bowen[6] and other public figures[7] tend to base their claim that renewables are not only clean but also cheap and reliable on two crucial sources: CSIRO’s annual GenCost report[8] and the Australian Energy Market Operator’s (AEMO) biennial Integrated System Plan (ISP).[9]
The purpose of GenCost is to provide updated cost estimates for investors in new-build electricity generation, storage and hydrogen production.[10] It is also used to provide forward-projected capital costs as an input to the ISP and claims to show that renewables are the cheapest, new-energy technology to build.[11]
The ISP provides a whole-of-system plan for the National Electricity Market,[12] aiming to design the lowest cost, secure and reliable energy system capable of meeting emissions targets.[13] It claims the lowest cost path for Australia’s energy transition is an energy system dominated by renewables and backed up by transmission, storage and gas.[14]
The outcomes of these reports are frequently conflated,[15] but careful reading exposes two distinct claims for which each are used as evidence:
- GenCost: That renewable energy is cheaper than alternatives, including fossil fuels, regardless of any cost of carbon or other policy constraints.
- Integrated System Plan: That the planned transition is the cheapest pathway to reach Australia’s emission reduction targets.
The key distinction between the two is that the ISP’s claim of economic superiority is confined to act within the boundaries of existing carbon budgets and renewables targets. However, GenCost is used to support the stronger claim that the renewables system is cheaper overall. In doing so, it relies to a significant extent on some of the more comprehensive modelling undertaken for the ISP’s integration of generation with transmission and storage. Indeed, GenCost is a collaboration between AEMO and CSIRO and a significant part of the funding for GenCost comes from AEMO.[16] Consequently, the merits and flaws of the reports are intertwined.
The net effect is that these reports have succeeded in creating a general aura of economic superiority for renewable energy over any alternative — including both the fossil-fuelled status quo or nuclear — with the overarching suggestion that our most respected technical and scientific institutions agree about this.
This report contends that neither GenCost nor the ISP credibly supports the two specific claims they each purport to make and the contention that renewables are clearly cheapest is not just unsupported but untrue.
This paper outlines six fatal flaws of logic that have allowed two major public institutions to continually repeat an incorrect statement. There are many other lesser problems with both reports which are not addressed in detail here.
The six flaws are not minor and are contradictory to the objective, evidence-based analysis that should underpin policy. Everyone, of all political persuasions — including ardent supporters of renewable energy, fossil fuels or nuclear energy — should be concerned with ensuring each of these is resolved.
Each of these six flaws is independently capable of collapsing the integrity of one or more of the formal claims of GenCost and the ISP. Taken together, they show that the overarching claim about the economic superiority of renewables in Australia’s energy transition plan is incorrect.
Flaw #1: Out-scoping costs
Sunk costs before 2030 in GenCost
CSIRO’s GenCost report outscopes storage and transmission project costs incurred before 2030, effectively treating them as a sunk cost,[17] which makes variable renewables (i.e. wind and solar) seem far cheaper than coal, gas and nuclear, even at high levels of penetration.[18]
GenCost is primarily concerned with costs to investors for different new-build generation and storage technologies at a particular time, not whole-of-system costs.[19] The key data GenCost uses to compare these technologies are capital costs and the Levelised Cost of Electricity (LCOE) — the average price of electricity an investor would need to receive over the life of their investment to recover both capital and operating costs.[20] However, the 2030 LCOE analysis treats pre-2030 transmission and storage projects as
‘free’,[21] making variable renewables appear to have relatively low integration costs compared to the costs of generation (see Figure 1).[22]
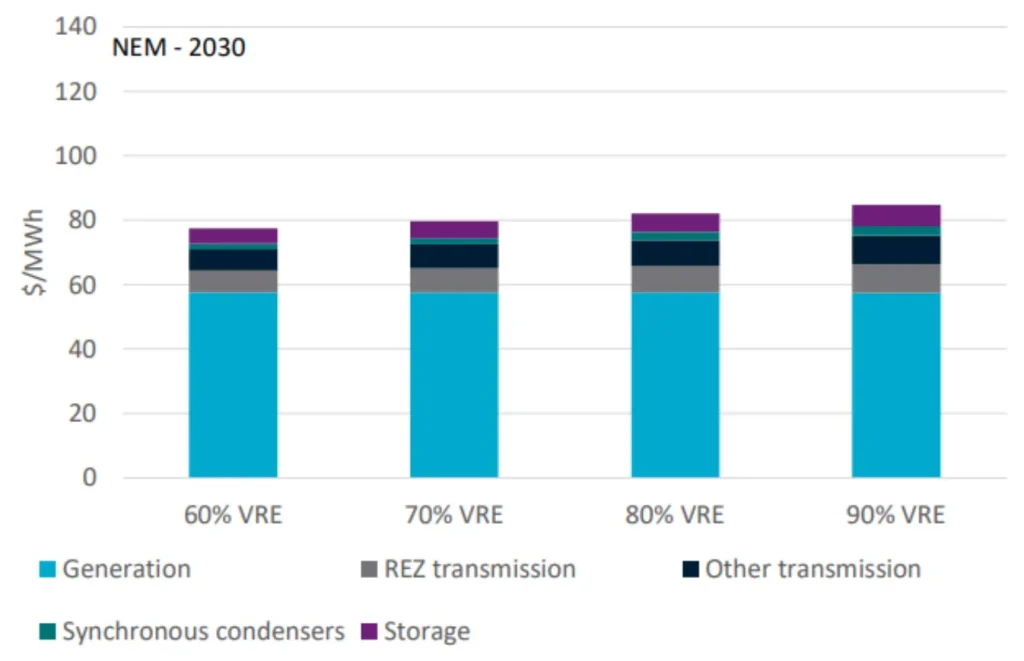
Figure 1. Levelised costs of achieving 60%, 70%, 80% and 90% annual variable renewable energy shares in the National Electricity Market NEM in 2030.
As renewables usage increases, the GenCost model forcibly retires coal plants.[23] This should result in transmission and storage costs dramatically increasing with higher usage, as reduced reliable baseload power necessitates renewable energy being transported further and stored for longer.[24] Although this sharp increase is commonly found in other studies estimating costs for increasing renewables penetration,[25] GenCost counter-intuitively depicts a negligible increase in integration costs from 60 to 90% variable renewables (Figure 1). If the costs of pre-2030 transmission and storage projects were fully included, the increase would likely have been much greater.
In response to concerns about the exclusion of pre-2030 integration costs being raised by stakeholders during previous GenCost report consultations, CSIRO has attempted to estimate these costs in the Draft 2023-24 report.[26] These 2023 integration costs include two gas plants, Snowy Hydro 2.0 and other major storage projects[27] and 11 transmission projects flagged by AEMO’s Integrated System Plan as being needed by 2030.[28] CSIRO “abstracts from reality” and assumes these projects can be completed immediately so that they can be included in the 2023 LCOE, [29] without accelerating the depreciation of these assets.[30] This means the 2023 analysis has essentially assumed the costs of pre-2030 transmission and storage projects can be fully paid off in 7 years so that they are completely free for the 2030 analysis, without any additional costs arising from this compressed timeline. This does not reflect reality, neither showing only the costs to investors nor the full costs a consumer would realistically face.
Additionally, no attempt was made to calculate what proportion of integration costs arising from these projects is necessary at each share of variable renewables — instead all costs are included regardless of renewables share.[31] This results in the pattern of decreasing costs with increasing penetration of renewables (Figure 2), because the cost of the pre-2030 storage and transmission projects can be spread over more variable renewable energy generation the greater the variable renewables share.[32] In reality, fewer transmission and storage projects would be needed with lower usage of renewables. Rather than clarifying the integration costs of renewables, this analysis only serves to mislead readers into thinking integration costs will become cheaper as more renewables are added to the system.
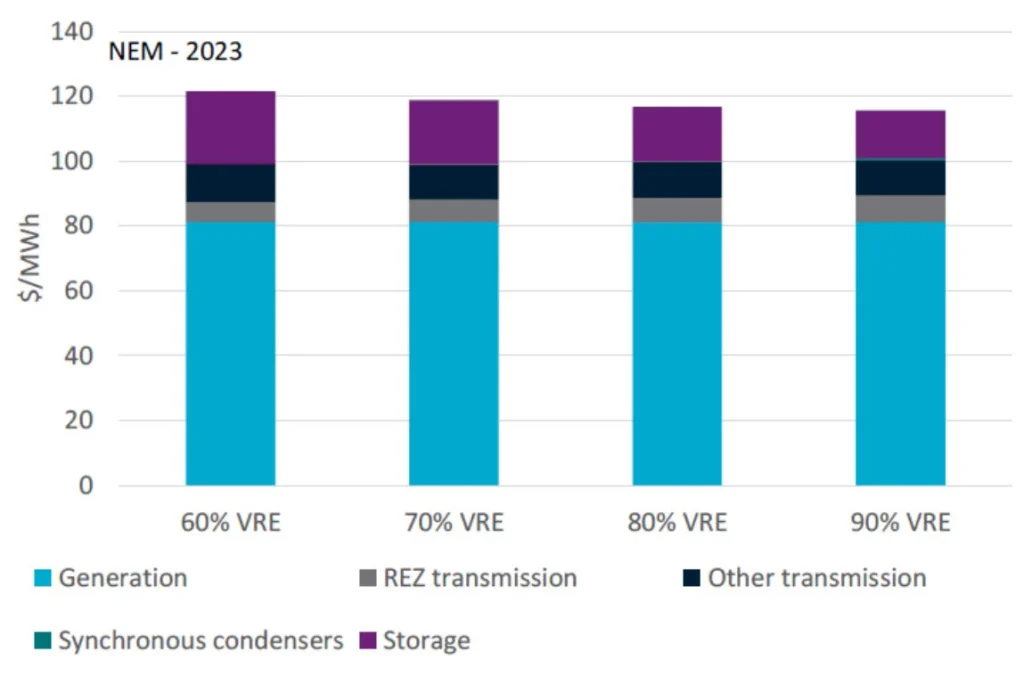
Figure 2. Levelised costs of achieving 60%, 70%, 80% and 90% annual variable renewable energy shares in the NEM in 2023.[33]
When compared with projections from the ISP, which CSIRO considers a “benchmark”,[34] the 90% variable renewable integration costs for 2023 seem unreasonably low. Analysing data from the ISP shows that the ratio of the cost of storage per unit generation is at least 75% greater for 90% variable renewables compared to 60% variable renewables.[35] Furthermore, calculating the annualised costs of batteries suggests a cost of approximately $24.60 per MWh (see Table 1), far more than the roughly $17 per MWh suggested in Figure 2, which should also include costs for Snowy 2.0 and other pumped hydro projects. These checks provide further evidence that the GenCost estimates for variable renewable integration costs are too low and are aberrant in their lack of any dramatic increase with variable renewable share, which is a common feature of other related studies.
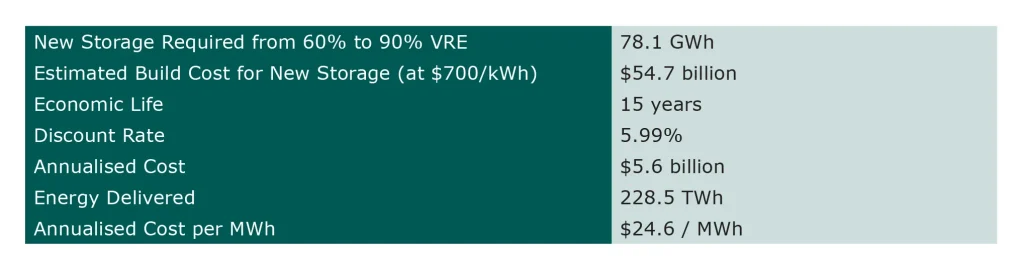
Table 1. Calculation of the annualised cost of additional storage capacity from 60% to 90% VRE.
CSIRO could have simply presented the costs an investor would face for different generation technologies and denied the Energy Minister’s claims that GenCost proves renewables are better for consumer’s energy bills than fossil fuels.[36] Instead, CSIRO has continued to support the unjustified claims of the Minister by attempting to quantify pre-2030 integration costs that no investor would face (i.e. transmission costs paid for through consumer bills). Although well-intentioned, this attempt has resulted in a confused analysis ultimately divorced from reality.
For future reports, CSIRO should either:
- Commit to conducting a complete assessment of total system costs, as would be faced by consumers (or taxpayers), at varying levels of renewables penetration, or
- Limit the analysis to only costs faced by an investor (i.e. excluding transmission costs) and clarify that GenCost does not provide evidence for a renewables-dominated system being cheaper for consumers.
Consumer Energy Resources treated as free in ISP
The ISP relies heavily on rooftop solar and home batteries, known as Consumer Energy Resources (CER), to provide generation and storage in coming decades, but does not include these assets as a cost.
Rooftop solar makes up the majority of solar capacity in the grid for the ISP’s forward projections (Figure 3). Likewise, coordinated CER storage (i.e. home and EV batteries connected to Virtual Power Plants [VPPs] that control their charge and discharge to the grid) makes up the lion’s share of storage from the mid-2040s onwards (Figure 3). Yet despite the forecast preponderance of CER, AEMO has “not included costs for household or residential batteries and solar PV because those are decisions that households and businesses make on their own” – the solar panels and batteries paid for by consumers are instead taken as an “input”.[37]
This crucial assumption is glossed over in the ISP’s executive summary, which states that the benefits of the Optimal Development Path include avoiding “$17 billion in additional costs to consumers”, without any mention that the annualised capital cost of all generation, storage, firming and transmission infrastructure, estimated at $121 billion,[38] does not include the cost of CER.[39]
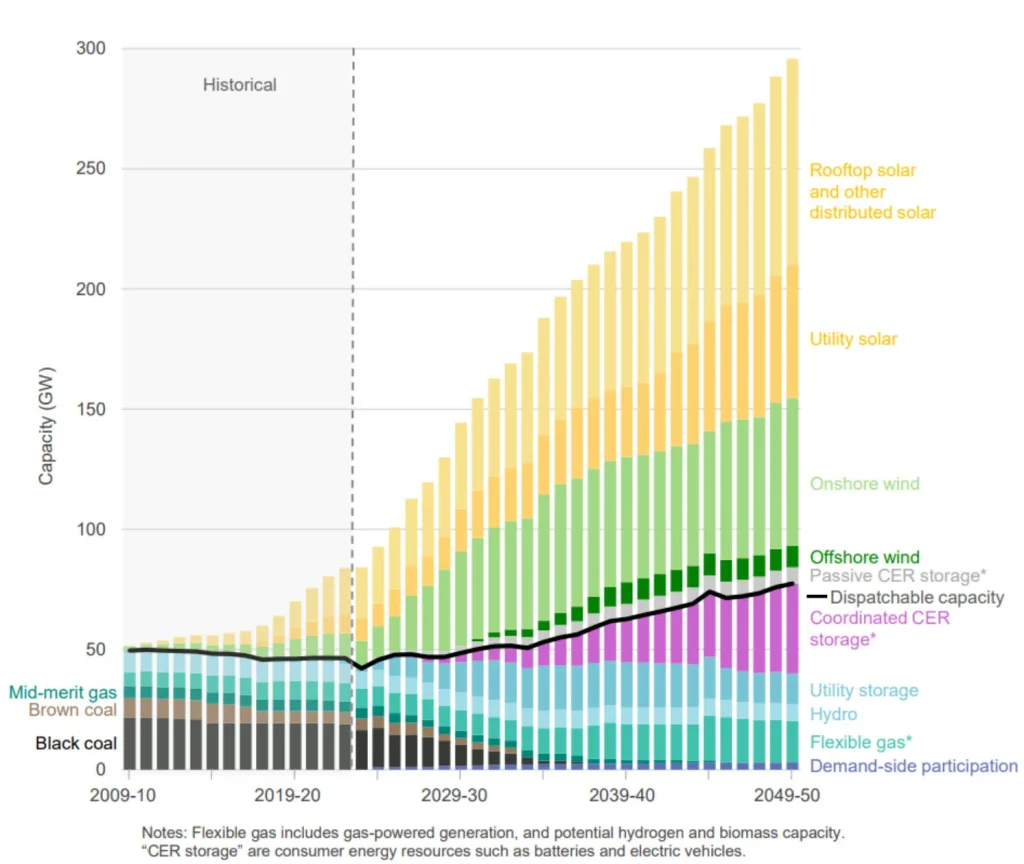
Figure 3. NEM capacity projections in GW in Draft 2024 ISP Step Change scenario from 2009-10 to 2049-50.
These excluded costs are significant, with the total cost of rooftop solar and consumer batteries up to 2050 totalling around $360 billion at today’s prices using GenCost’s estimates.[41] This is much higher than the $130 billion cost of large-scale solar and batteries up to 2050 (which the ISP does include).[42]
AEMO has responded to stakeholder concerns about the treatment of CER as a static input by stating that the ISP “doesn’t try to dictate what consumers do” but rather adapts to consumer preferences.[43] However, these preferences are largely shaped by government policy that determines the financial benefit consumers expect when making those investments. When determining the forecast uptake of rooftop solar in the ISP model, AEMO takes into account government policies that provide financial incentives for consumers (e.g. Small Technology Certificates and feed-in tariffs)[44] — without including them as a system cost. AEMO also includes financial incentives for CER storage (i.e. home batteries and EVs) to forecast uptake,[45] including South Australia’s $3000 subsidy for new EVs,[46] which ended in January 2024.[47] Furthermore, AEMO makes the assertion that the “optimistic outlook for coordinated CER storage” will require “continual reforms of tariffs, market incentives and policies”[48] — without any attempts to estimate the associated costs.
Financial incentives are clearly needed to convince consumers to allow their batteries to be coordinated. The coordinated CER trial Project EDGE found that almost half of consumers had little to no interest in joining a VPP (Figure 4). The project report further stated that the widespread adoption of CER and VPP to reduce carbon emissions was “less valued by consumers relative to having a reliable supply of power, saving money and receiving good service.”[49]
Thus, not only do consumers want to be adequately compensated, they also want to use their battery to maintain a reliable source of power (including during peak demand or a blackout). This is at odds with the way VPPs operate, as they are incentivised to sell power from customer’s batteries back to the grid when spot prices are highest, which will occur during a period of peak demand or blackout. The contradictory incentives for CER customers and VPPs therefore make achieving the projected levels of coordinated CER storage difficult — and expensive.
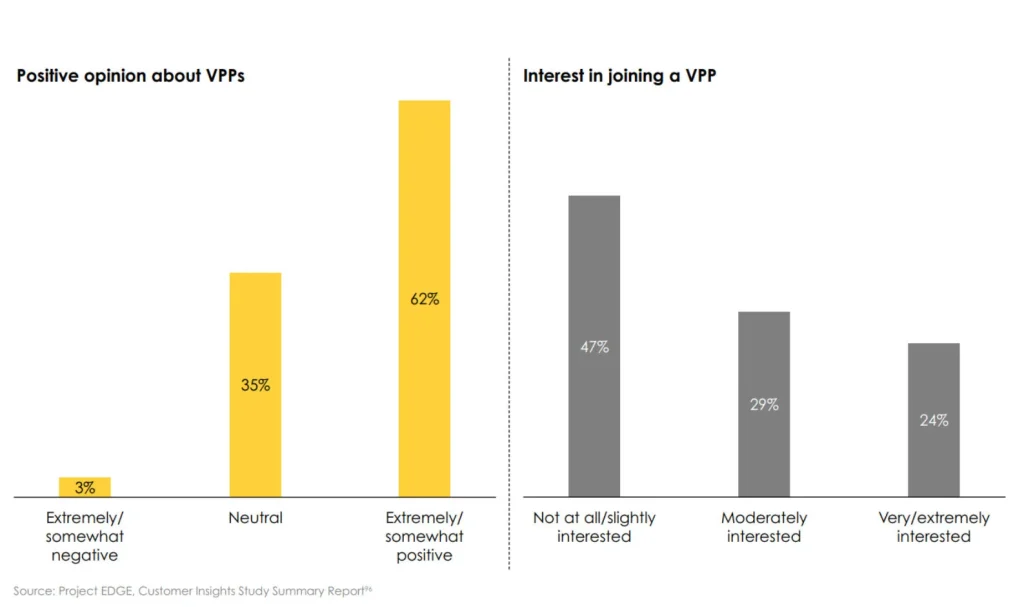
Figure 4. Consumer perceptions about VPPs and interest in joining a VPP from Project EDGE surveys.
Financial incentives are also needed to encourage consumers to change EV charging behaviour. The ISP models convenience charging (i.e. charging at home immediately upon arrival after work during peak time) as dropping from around 73% of the time in 2022-23 to below 36% in 2050, while coordinated charging (i.e. charging during non-peak times and discharging to the grid during peak times) rises from 0% to around 32%.[51] There is no opportunity cost modelled with this forecast — instead, the ISP references the “right incentives and systems” that will encourage EV owners to relinquish control of their EV batteries and charging habits to serve the needs of the grid.[52] Research reveals less than 17% of EV owners would consider changing their charging time to between 10am and 2pm (i.e. when solar output is at its peak) without an incentive.[53]
Significant outlays will be required to upgrade distribution networks to ensure grid stability as CER installations grow. The cost of distribution network upgrades is significant, with an Energeia project paper estimating the total cost of mitigating over-voltage due to solar installations over the next 20 years as being between $0.7 to $1.1 billion, depending on the level of CER adoption.[54] Yet, the ISP does not take these costs into account.[55] Flagging this issue, the ISP Consumer Panel stated: “While AEMO describe the ISP as a ‘whole of system’ plan, it is in practice, a ‘whole of transmission’ plan with limited involvement of distribution networks.”[56]
AEMO’s mischaracterisation of what is essentially a transmission planning exercise as a ‘whole-of-system’ plan contributes to policymakers such as Energy Minister Chris Bowen inappropriately using the ISP as evidence that a renewables-dominated grid is cheap.[57] The Minister said the ISP “looked at… in current dollars, the total cost out to 2050 of the entire generation, storage and transmission and came up at $121 billion.”[58] As this number excludes the $360 billion of CER calculated above and the associated costs of distribution network upgrades, the true cost would be greater than the figure quoted by Mr Bowen.
Policymakers need to be able to directly compare different mixes of technologies in the energy system to have accurate information about whole-of-system costs, as government incentives and programs greatly influence consumer and investor decisions. By excluding the costs associated with CER (such as capital, installation, maintenance, incentives to encourage uptake and behavioural shifts in charging and distribution network upgrades), AEMO has not provided a fair comparison of the costs and benefits of CER versus large-scale solar farms and batteries. This lack of co-optimisation prevents policymakers from making informed decisions and prevents consumers from knowing the true cost of their decisions regarding rooftop solar and home batteries as well as the ensuing bill impact of the energy transition.
According to the CSIRO, large-scale solar and batteries are cheaper than small-scale rooftop solar and home batteries,[59] which means the ISP’s heavy reliance on uncosted CER is likely to increase overall system costs for consumers. Additionally, network service provider Ausgrid has stated their “marginal expenditure typically occurs on low voltage distributors”, the part of the network most affected by rapidly growing CER.[60] This raises the question of whether distribution network upgrades required by CER growth will drive up system costs far more than the transmission network upgrades needed by an equivalent amount of large-scale solar and batteries. Despite growth in CER likely to increase total system costs, AEMO continues to use CER to offset the amount of large-scale battery storage[61] and solar (Figure 3) in the grid.
To provide policymakers and consumers with a whole-of-system plan for the energy transition, AEMO should model CER as a system cost, including capital, installation, maintenance and incentives to encourage uptake and behavioural shifts in charging and distribution network upgrades. CER should be co-optimised to accurately compare the costs of a low-CER grid versus a high-CER grid.
Costs of recycling renewables and battery waste not included in ISP
Costs associated with recycling wind turbines, solar panels and batteries are not included in the ISP, making renewables seem cheaper than they are over their lifetime.
AEMO’s claim to include disposal and recycling costs of generation assets in their model[62] is false. Retirement costs for solar and on-shore wind are taken from a 2018 GHD report that does not include disposal or recycling of solar panels and wind turbines.[63] Further, all large-scale battery retirement costs are excluded because “disposal cost data is not known.”[64] AEMO also does not attempt to include any retirement costs for offshore wind facilities, claiming their long construction time means that “retirement costs would be incurred beyond the end of the ISP modelling horizon.”[65] This reasoning is flawed, as no investor would start such a project without having a cost estimate for decommissioning and rehabilitating the site once the plant reaches the end of its life.
The omission of disposal and recycling costs essentially means the ISP has assumed all waste from solar panels, wind turbines and large-scale batteries is either abandoned on-site or taken to landfill at no cost. This is unrealistic, given Australia’s legislative environment is increasingly making recycling the only option. In Victoria and South Australia, solar panels and batteries have been banned from entering landfill and must be recycled or stored until they can be recycled.[66] Western Australia has announced similar restrictions, Queensland is in the consultation phase and the federal government is also developing a mandatory product stewardship scheme which could make solar panel manufacturers and importers liable for recycling costs.[67]
None of these costs is included in the Draft 2024 ISP. The ISP’s retirement/rehabilitation cost estimates for wind and solar therefore appear low compared to coal, gas and pumped hydro (see Figure 5).
AEMO should include the estimated costs of disposal and recycling for all wind turbines, solar panels and batteries, including CER, in their model so the ISP can accurately optimise system costs arising from generation and storage.
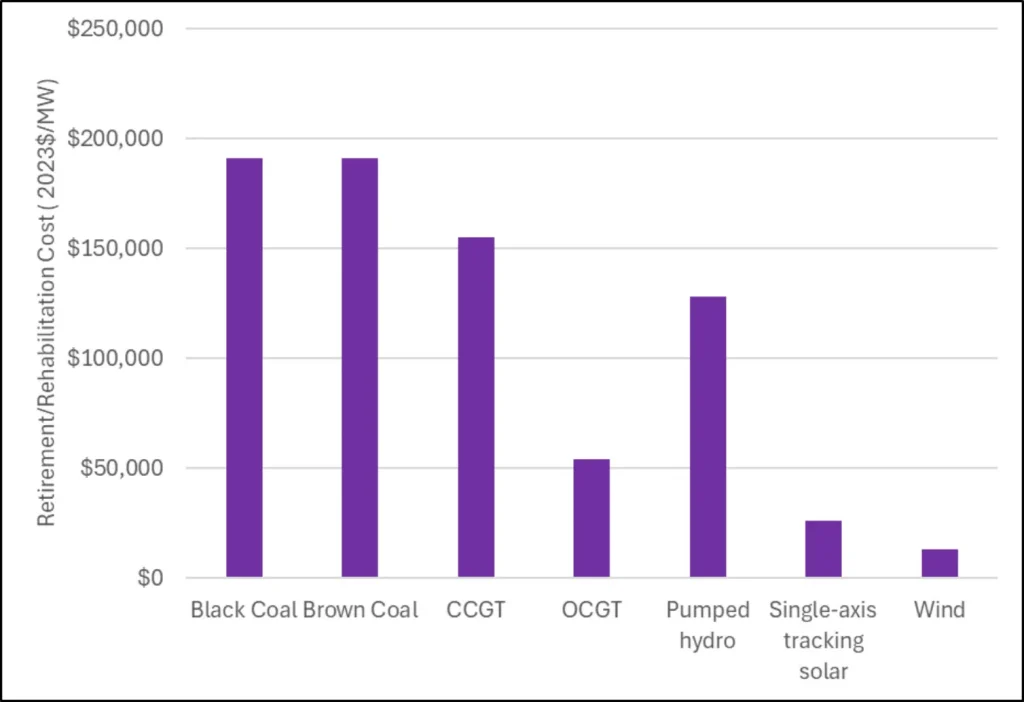
Figure 5. Retirement/rehabilitation cost estimates of different generation technologies in the Draft 2024 ISP.
Flaw #2: Outscoping carbon
Lifecycle emissions of renewables not considered in ISP
The ISP does not include emissions arising from the manufacturing of wind, solar and battery systems, making renewables seem cleaner than they are. It also means the claim that this plan allows us to comply with a particular carbon budget is not credible in the global sense, since significant emissions will simply be exported to other countries whose emissions will increase.
The ISP accounts only for direct emissions (i.e. Scope 1), such as the burning of coal or gas, and excludes the emissions arising from production of the steel, concrete, composites, silicon and electronics that comprise wind, solar and battery systems.[69] This results in the model assuming solar, batteries and wind are entirely emissions-free (Table 2). This exclusion of indirect (i.e. Scope 3) emissions in the ISP’s accounting effectively exports large quantities of emissions to the countries which manufacture solar panels, wind turbines and batteries for Australian customers. For example, China is Australia’s main supplier of solar panels[70] and a key supplier of wind turbines[71] and battery storage systems,[72] with an electricity grid highly reliant on coal, particularly for energy-intensive applications such as manufacturing.[73]
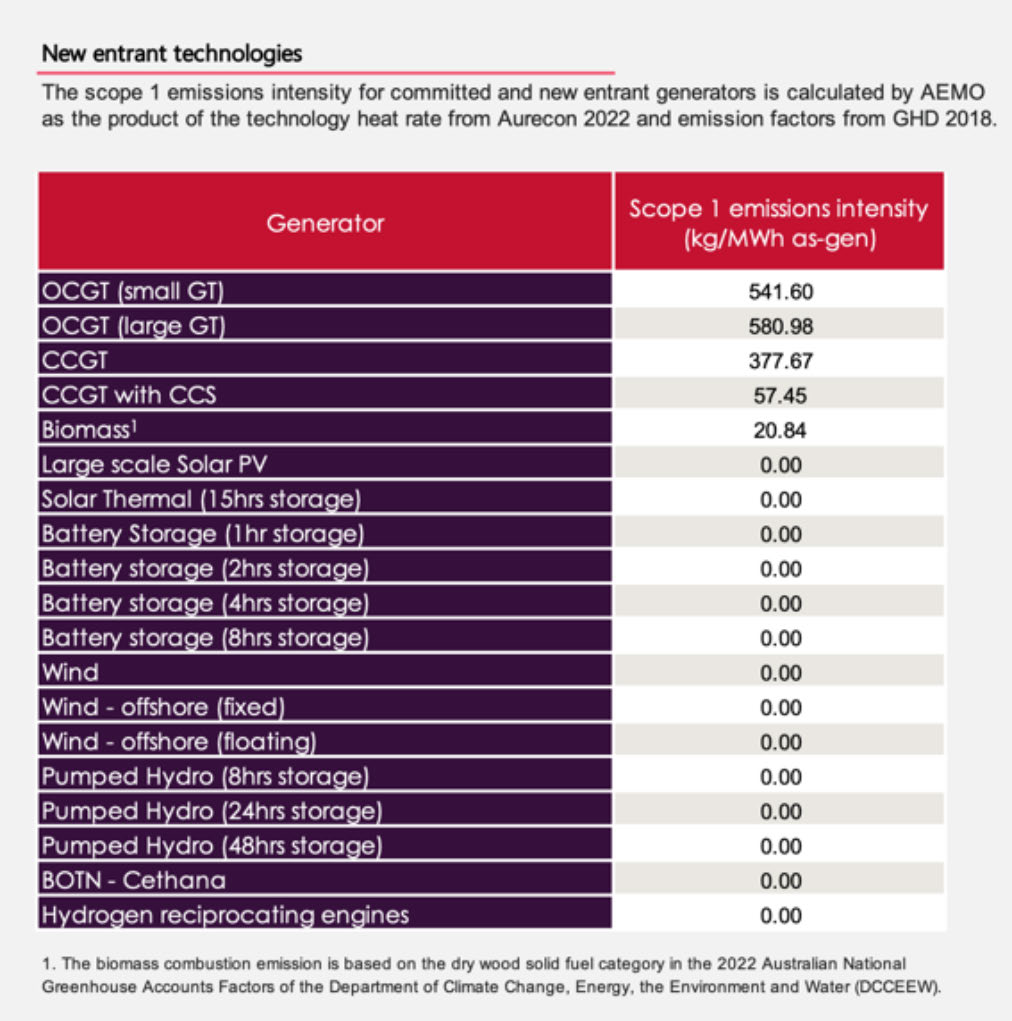
Table 2. Emissions intensity for new entrant technologies in the 2023 Inputs, Assumptions and Scenarios Report (IASR).
Scope 3 emissions, including the emissions generated from the manufacturing process,[75] often account for more than 70 percent of a business’ carbon footprint, as noted by Deloitte.[76] These indirect emissions are the only source of greenhouse gas emissions associated with solar panels, wind turbines and battery systems. By excluding lifecycle emissions of generation and storage technologies and only considering direct (Scope 1) emissions, the ISP likely over-represents the emissions reductions that would occur with high usage of solar, wind and batteries. Figure 6 shows emissions intensity in the Optimal Development Path in the Draft 2024 ISP has the potential to be around 6 times higher than AEMO has forecast, if reasonable estimates of Scope 3 emissions are included from solar, wind and batteries. Using the top end of Scope 3 estimates, emissions intensity could be 12 times higher. This raises doubt over whether the current energy transition plan will achieve net zero by 2050. Note: The ODP emissions trajectory is taken from the Draft 2024 ISP ODP’s projected emissions intensity under Step Change.
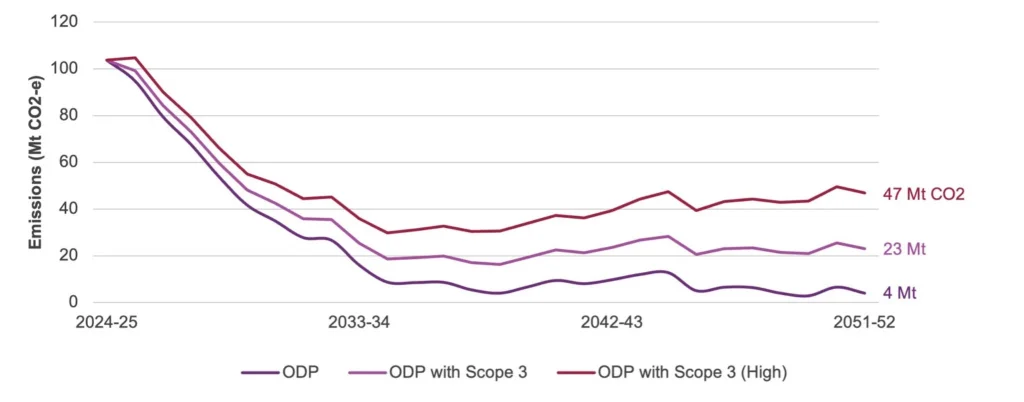
Figure 6. Projected emissions intensity in the ISP’s Optimal Development Path, with CIS’s central and high estimates of emissions intensity if lifecycle emissions for solar, wind, and batteries are included.
For the ISP’s emissions intensity projections to accurately capture the differences between fossil fuels and wind, solar and batteries, AEMO needs to include modelling of Scope 3 emissions in accordance with the carbon intensity of the grid where generation and storage technologies have been or are likely to be manufactured. This will prevent Australia going down a path where our domestic emissions are reduced at the expense of increasing emissions in the country selling us solar panels, wind turbines and batteries.
Flaw #3: ‘Match-fixing’ the energy transition
Lack of a neutral baseline scenario in the ISP
The ISP claims a renewables-dominated grid is the cheapest option for our energy system without a comparison to any alternative, namely coal or nuclear. This failure to compare technologies on an even playing field amounts to apparent ‘match-fixing’ the energy transition. AEMO does this by excluding any scenario without renewables and carbon targets that could be used as a neutral baseline and reveal the true cost of policy decisions.
The CEO’s preface for the ISP states: “Renewable energy connected by transmission, firmed with storage and backed up by gas is the lowest cost way to supply electricity to homes and businesses through Australia’s energy transition.”[85] This is a tautology — there is no other conclusion the ISP could have reached regarding the cheapest option, given its exclusion of nuclear due to its legal status and the removal of the only baseline scenario that could have allowed for coal refurbishments or replacements in the model.
If AEMO had framed the ISP’s purpose as being restricted to identifying the cheapest path for building transmission to support a renewables-dominated grid, this exclusion of coal and nuclear would be understandable. But instead, the ISP has made the broader claim of finding the “lowest cost way to supply electricity”. This has resulted in Energy Minister Chris Bowen and Science Minister Ed Husic announcing the ISP “confirms that a renewable grid with hydro, batteries, flexible gas and transmission is the lowest cost way to deliver a secure and reliable energy grid.”[86] This assertion implies that other feasible alternatives have been tested through a cost-benefit analysis when none has.
Rather, AEMO has allowed government policy (i.e. renewables and emissions reduction targets and a dismissal of nuclear) to dictate the assumptions in its model, thus ‘match-fixing’ the outcome. This circularity — where policy shapes the ISP which then endorses the policy — limits a transparent evaluation of alternatives, entrenching predetermined policy directions without a full accounting of their costs and benefits.
Feasible alternatives to renewables were excluded from the analysis through the selection of scenarios that enforces binding renewable energy and carbon targets.
In the 2021 Inputs Assumptions Scenarios Consultation (IASC), there are five scenarios — Slow Change, Steady Progress, Progressive Change, Step Change and Hydrogen Superpower — all of which assume a 26-28% reduction in emissions by 2030.[87] However, only the latter three scenarios assume a target of net zero by at least 2050 — Slow Change and Steady Progress do not have this constraint.[88]
The Steady Progress scenario was originally derived from the Central scenario in the 2020 ISP,[89] previously named ‘Current Trajectory’,[90] and was consequently considered a highly relevant reference point. The other scenario derived from ‘Central’ was initially called ‘Net Zero 2050’[91] before being renamed ‘Progressive Change’.[92] This scenario was very similar to Steady Progress, except for a much larger industrial electricity load and a binding emissions reduction target.[93] Steady Progress was the most realistic counterfactual to assess potential costs of transitioning to renewables, due to its lack of a binding carbon budget and use of “central estimates for technological and macroeconomic influences” — particularly coal prices.
At the original Delphi Panel[94] for the 2022 ISP, Steady Progress was given the same weighting of likelihood as Hydrogen Superpower, an ambitious scenario assuming Australia becomes a major exporter of green hydrogen.[95] This meant that participants rated a scenario with no binding emissions reduction target as equally likely as an extremely optimistic scenario with “significant technological breakthroughs and social change to support low and zero emissions technologies”.[96] Together with Slow Change, the Delphi Panel gave an 18% weighting to scenarios that did not include the binding net zero target.[97] Slow Change assumed slower-than-anticipated emissions reduction, depicting a future in which Australia did not reach the economy-wide decarbonisation objectives of the Emissions Reduction Plan.[98]
However, after the announcement of the 2050 Net Zero target at COP26, AEMO discarded the results of the first panel, calling on a new panel to develop new weights for the 2022 ISP.[99] There was no public consultation on the results of the second panel — even the official ISP Consumer Panel members were excluded — before these weights were adopted by AEMO as the Draft ISP weights.[100] Also, the size and composition of the panel was in breach of the official ISP Methodology.[101]
For the Second Delphi Panel, Steady Progress was removed from consideration, apparently due to its “failure to meet net zero ambitions”.[102] However, no explanation was given for retaining Slow Change, which also did not have a binding net zero target. Given that Slow Change had far fewer votes in the first Delphi Panel (5% instead of 13%),[103] removing the least likely scenario that wouldn’t meet the target would appear to be logical.
Given that no coal plant refurbishments or new brown coal were allowed by AEMO’s assumptions,[104] only new or refurbished gas plants or new black coal would be possible. However, by removing Steady Progress with its central price assumptions, the only scenario able to show how much coal and gas the cost-optimising model would recommend without a binding carbon target (i.e. Slow Change) used coal and gas price assumptions higher than any other scenario.[105]
This may have been a critical factor in determining the eventual generation mix. Including Slow Change, and excluding Steady Progress, meant AEMO could present relatively uniform scenarios in the 2022 ISP that all eventually reached net zero without replacing coal or gas with only a 4% weighting given to the Slow Change scenario with no binding emissions reduction target.[106]
The AEMO decision to re-run the Delphi Panel, without oversight from the Consumer Panel or public consultation, removed the only scenario that could have been used as an appropriate counterfactual in the 2022 ISP.
This issue of a lack of neutral baselines becomes more problematic in the 2024 ISP, with AEMO removing Slow Change, the only scenario remaining without a binding renewable energy or carbon target.
The removal of Slow Change means all remaining scenarios model a 43% emissions reduction target in the carbon budget up to 2030, an 82% share of renewable generation by 2030 and a net zero emissions target by 2050.[107] Though hamstrung by high coal and gas prices, Slow Change represented the last opportunity to establish a baseline to test the benefits of a proposed infrastructure pathway when emissions targets are missed and renewables penetration is lower.[108]
AEMO decided to remove Slow Change on the basis it was “no longer consistent with the pace of transformation required by the collection of policies facing Australia’s energy industry”.[109] AEMO further justified this decision by claiming “a majority of stakeholders supported the Slow Change scenario’s removal, consistent with its very low relative likelihood in the 2022 ISP”.[110] This is false.
A majority of stakeholders did not support the removal of Slow Change with 56% either agreeing that the scenario is still relevant or not having an opinion either way (Figure 7). In fact, the majority of comments from stakeholders in the consultation webinar were supportive of keeping Slow Change in the analysis, particularly as a “bookend”, “benchmark”, “baseline” or “counterfactual” which is “necessary to check for regretted investment”.[111]
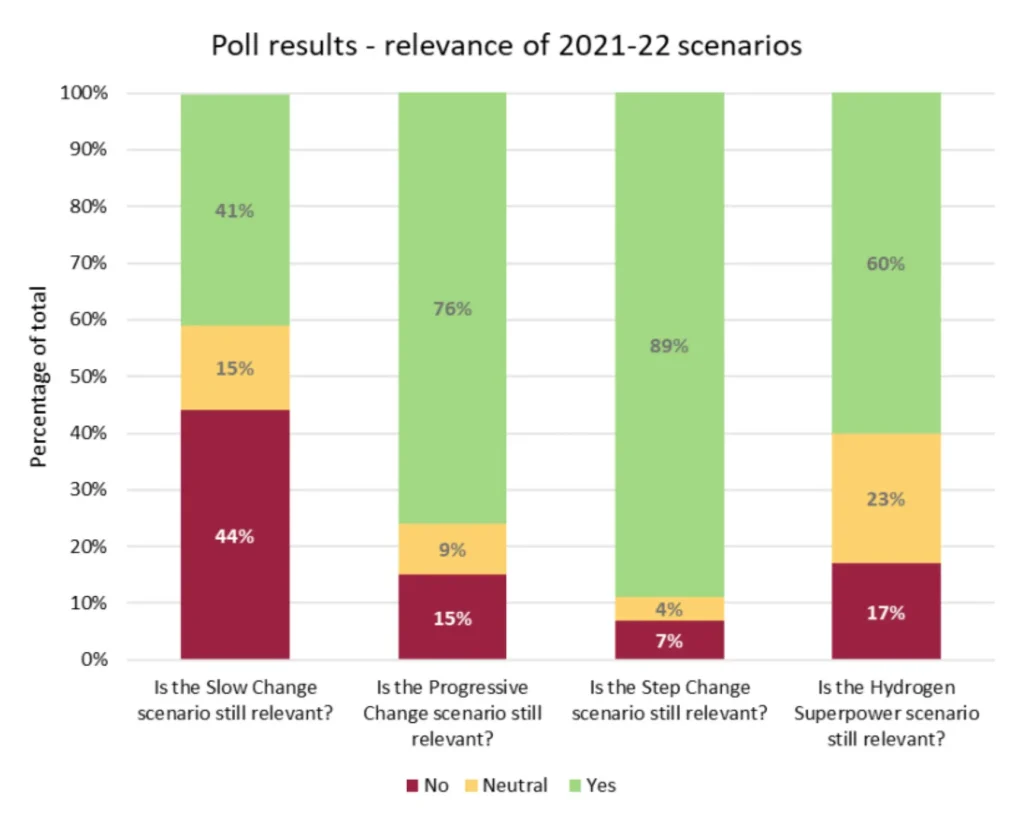
Figure 7. Poll results from 2023 Preliminary Scenarios Webinar feedback regarding the relevance of scenarios in the 2022 ISP to the Draft 2024 ISP.
As one stakeholder pointed out: “It’s likely to be worthwhile including one scenario that is relatively ‘pessimistic’ in terms of abatement progress, economic growth, tech costs etc in order to get a wide spread of possible scenarios. Scenario planning is not just about what stakeholders want to happen.”[113]
Another stakeholder emphasised the increasingly volatile geopolitical environment as being a reason for keeping Slow Change: “The scenario may still be relevant for representing the uncertainty in economic recovery post pandemic and into the Russian invasion of Ukraine. It represents a de-prioritisation of decarbonisation and more emphasis on energy security.”[114] Even some of those who thought the scenario unlikely supported it remaining with one stakeholder saying: “It may not be a likely scenario but it is important to have a good spread to see the impact of different futures. It also avoids the concern of ‘bias’.”[115]
AEMO did not heed the concerns of these stakeholders and proceeded to remove Slow Change, thus creating a bias towards the high end of emissions reduction and renewables capacity trajectories in the scenarios tested in the ISP model . As AEMO has also not performed sensitivity testing for emissions reductions or renewables capacity falling below government targets, the cost to the consumer arising from over-investment in transmission if targets are missed remains unknown.
AEMO needs clarity about the ISP’s purpose and findings, particularly the fact that it does not test the full range of feasible alternatives for Australia’s grid and therefore cannot support the claim that a renewables-dominated grid is the cheapest way of supplying electricity. To test this claim, the AEMO must include an unconstrained counterfactual scenario in its analysis that does not presuppose policy commitments in order to reveal the true cost of government targets and commitments. Without it, the selection of scenarios towards more ambitious targets prevents a proper cost-benefit analysis being performed on an even playing field.
Forcing preferred transmission outcomes through input and constraint manipulation
The second Delphi Panel discussed previously saw votes flow from the (eliminated) Steady Progress to Step Change and saw the Progressive Change scenario (renamed from the previously most popular Net Zero 2050 scenario) fall to second place, also losing votes to Step Change.[116] This substantially increased the overall weightings of scenarios that required the most rapid and ambitious uptake of renewables and assumed the fastest closures of coal.
This shifted the optimal timings of three of the largest transmission projects that were previously listed as actionable: VNI West, HumeLink and Marinus Link. If the initial weightings of the first Delphi Panel were used, with Progressive Change the most likely scenario and Steady Progress equally weighted with Hydrogen Superpower, none of these projects would have been advanced immediately as actionable projects.[117]
Given that multiple billions of dollars of investment hinge on this shifting of scenario weights, considerable attention should be paid to the circumstances in which the initial weights were discarded and the panel re-run. With the Net Zero 2050 scenario already being the initial winner and Slow Change having only a small portion of the votes,[118] it would have been perfectly reasonable to use the initial weightings. No serious claim can be made that the possibility of Australia adopting a net zero 2050 target was not appropriately considered in the initial weightings.
The overall effect of re-running the Delphi Panel was not just to eliminate the most likely counterfactual without a carbon target but also to ensure regulatory approval of many billions of dollars of transmission at the fastest possible schedule. Without any credible claim that the initial Delphi Panel was worse than the second one, this amounts to AEMO seemingly intervening to shift the path of the nation’s transition plan away from what is optimal for consumers to a plan that better suits the interests of transmission companies and renewable energy investors.
Flaw #4: Overfitting the model
Model builds just-in-time gas capacity for perfectly-predicted weather in ISP
Overfit models work very well for a limited set of data but tend to fall apart when faced with the unpredictability of the real world. AEMO has overfit the ISP’s model by assuming perfect weather for the next few decades and building flexible gas capacity before weather events which are poor for renewables, while also timing battery retirements so they occur just after such years of unsuitable weather.
AEMO does not test the ISP model against a range of potential weather conditions to ensure grid reliability. Instead: “AEMO’s energy market modelling is optimised with the benefit of perfect foresight of VRE [i.e. wind and solar] output and operational demand within each simulated day.”[119] This foresight of perfect weather decades in advance is a serious departure from reality. AEMO then ensures unserved energy (i.e. blackouts) are avoided by “allowing the model to build flexible gas to take into account those chances of unserved energy”.[120] Flexible gas capacity projections are thus overfit to a particular set of weather conditions.
This results in the pattern of flexible gas capacity for the next few decades being very lumpy, with some years having no new capacity built or reduced capacity from retirements, while other years have unprecedented amounts of new capacity built (Figure 8). The biggest increase in one year occurs in 2045, when 4 GW of new capacity is built, reaching a peak in total capacity of 18 GW. To understand the scale of building 4 GW of flexible gas in one year, the largest power station in Australia (Eraring) has less than 3 GW of capacity.[121]
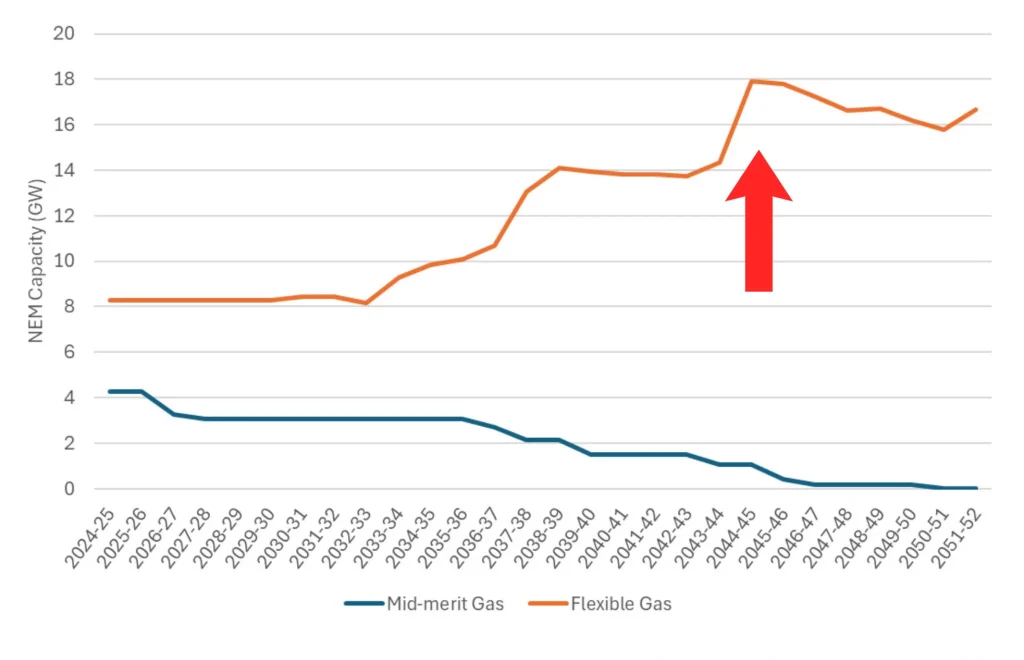
Figure 8. Gas capacity for mid-merit gas and flexible gas across the NEM in the Draft 2024 ISP ODP under Step Change.
2045, the year of peak flexible gas, is conveniently the same year in which solar capacity factors across most solar farms experience a marked drop (Figure 9). The ISP model builds just-in-time gas capacity to get through this apparently cloudy future year with no consideration of what would happen if the bad solar year came one or two years earlier when gas capacity is lower.
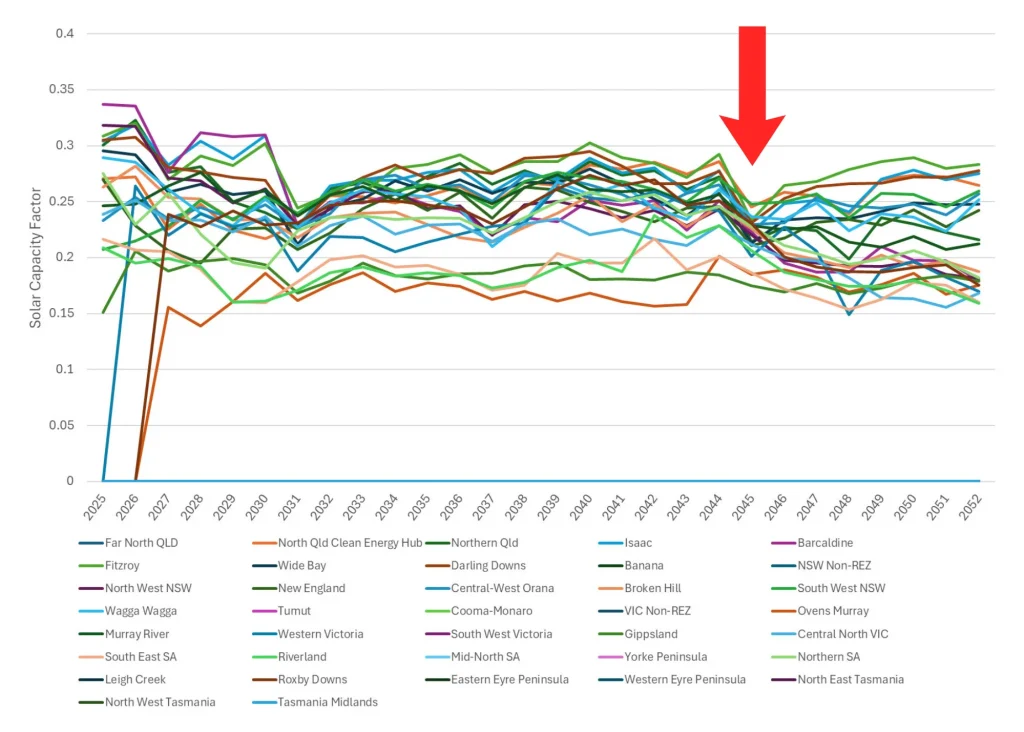
Figure 9. Solar capacity factors for solar farms across the NEM in the Draft 2024 ISP ODP under Step Change.
The ISP model also perfectly times large-scale battery construction and retirement so that extra storage capacity is available for apparently cloudy future years. The storage capacity forecast in the ISP grows steadily, apart from a curious dip in 2045-46 (Figure 10). This occurs because shallow storage capacity (1-2 hour batteries) is assumed to halve in one year, falling from 8 GW in 2044-45 to 4 GW in 2045-46. This represents the retirement of the 4 GW of shallow batteries built in 2025-26, as they have an assumed economic life of 20 years.[124] The retirement of these batteries falls directly after 2045, the year assumed to have particularly low solar output, so they can be used to support the grid through the solar drought and then never replaced again.
This means AEMO has, as in the case of flexible gas, overfit the construction of large amounts of batteries in the ISP model by assuming a bad solar year will occur in 2045. The model choosing to build such a large amount of batteries in one year instead of spreading construction to avoid sudden decreases in capacity is further evidence that the ISP’s model is not fit for purpose and is likely to fail when faced with the unpredictability of weather events.
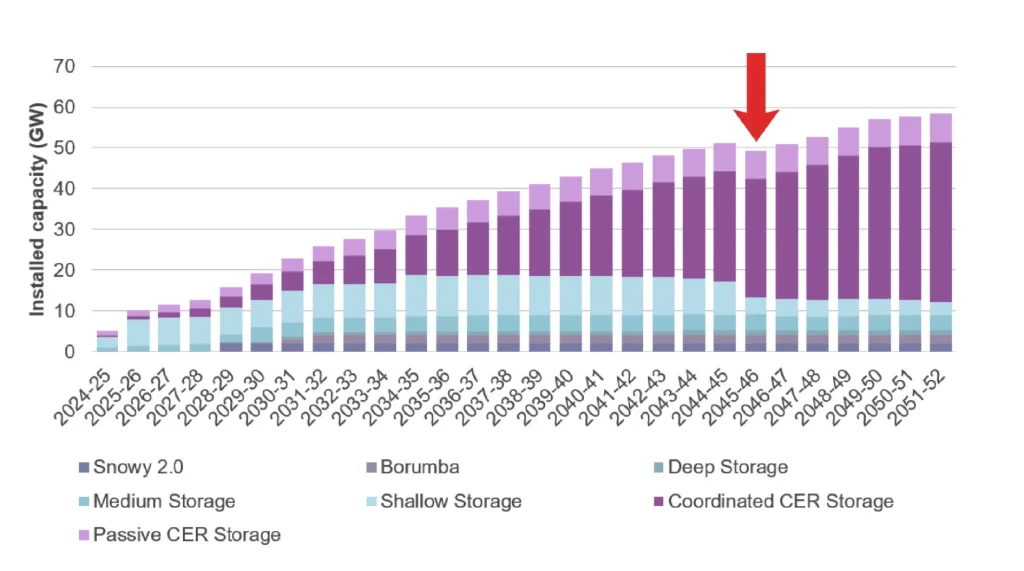
Figure 10. Draft 2024 ISP forecast for NEM storage capacity in GW by year under Step Change.
AEMO should fix the overfitting of the ISP model by running it through a range of potential weather sequences. This could be done by testing the capacity in each year of the model to ensure no major blackouts will occur if 1-in-30-year lows in solar and wind output were to eventuate. Without doing this, consumers have no assurance the energy transition plan laid out by AEMO will prevent major blackouts in bad weather years.
Flaw #5: Disintegrating the integrated system
Methodology breaks apart integrated system in ISP
AEMO’s method for determining the value of individual projects does not treat the energy system as an integrated whole but rather a collection of parts largely independent of one another. This allows uneconomic projects to be approved and costs passed onto consumers.
AEMO uses the take-one-out-at-a-time (TOOT) method to provide an estimate of the sensitivity of each transmission project in the Optimal Development Path to cost variations. This is supposed to determine each project’s benefits and the threshold of cost increases that would lead to a project no longer being beneficial for the grid.[126]
TOOT analysis is performed by taking out a particular transmission project and any associated capacity augmentations from the Optimal Development Path (e.g. removing the transmission link that deepens the connection capacity between a Renewable Energy Zone and the rest of the grid, as well as removing the increased renewables capacity that would be built in that zone).[127] The TOOT results are crucial for the ISP to ensure final approval is not granted for previously recommended transmission projects that face cost blowouts which would make them uneconomical.
However, the TOOT analysis in the ISP is unsuitable to serve its intended purpose. This is made clear by the fact that the sum of the calculated net benefits of just a subset of transmission projects in the Optimal Development Path matches the total net benefits of all transmission projects. AEMO claims the total net benefits of the Optimal Development Path amount to $17 billion[128] — but according to the TOOT analysis, this $17 billion sum is exceeded by adding up the individual project benefits even before Queensland Supergrid North or QNI Connect have been added (Table 3). This means individual projects have been valued as greater than logically possible given the total value of the system, thus artificially inflating their actual benefits to make them appear more desirable.
This issue has arisen because the TOOT analysis breaks down the integrated system into independent parts, many of which do not make sense to build unless complementary parts are also included. To illustrate, it is as though AEMO determined the value of a bicycle by taking away each individual part and seeing how much less the bicycle was worth as a result. If the chain is removed, the bicycle is almost worthless and so the chain is assigned almost the same value as the whole bike. Likewise for the pedals, the wheels and so on until the sum of all the individually-valued parts is many times that of what the bicycle is actually worth.
A better approach would be for AEMO to consider certain projects that are dependent on one another for their value as subsystems that should not be separated in a TOOT analysis. This approach ensures a proper understanding of the threshold of transmission cost increases that would make a project no longer viable.
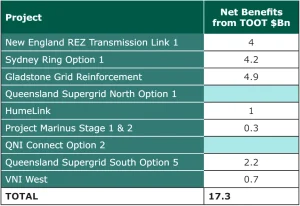
Table 3. Net benefits of projects in Draft 2024 ISP, excluding Qld Supergrid North, QNI Connect and minor projects that were not provided.
Government-committed projects locked in without proper scrutiny in ISP
The ISP treats government-committed projects with costs yet to be sunk as locked in and therefore makes no attempt to assess their benefits to the system. This, combined with the way the system is dismantled by the TOOT analysis, results in transmission projects that link these assets appearing more valuable than they would be otherwise, paving the way for further projects to be locked in without the whole system ever being fully optimised.
Transmission projects that have not passed the required cost-benefit test, the Regulatory Investment Test for Transmission (RIT-T), can now be considered locked in by going through a less rigorous state government process that does not optimise the whole system. For example, the NSW Government’s new Transmission Efficiency Test allows transmission projects to bypass the more stringent RIT-T[130] and proceed by simply proving the project can be delivered efficiently, regardless of whether it is a good idea in the first place.[131] This sidestepping of the RIT-T has occurred with the Central-West Orana REZ Transmission Link.[132] Similarly, an amendment to the National Electricity (Victoria) Act 2005 allows the RIT-T to be bypassed at the Victorian Energy Minister’s discretion.[133] Passing off responsibility for verifying the economic viability of a project to the states in this way essentially allows boondoggles to be built as long as they are built efficiently.
Committed projects being treated as sunk costs have inflated the value of the major transmission projects linking NSW and Victoria: HumeLink and VNI West. Snowy Hydro 2.0 have been treated as sunk costs in the ISP model because it is a federal government commitment expected in 2028,[134] despite, after a series of significant delays, only $5 billion of funds has been spent, with $7 billion yet to be spent.[135] Even if just $6 billion of Snowy 2.0’s costs were included in the model, the net present value of HumeLink without competition benefits would sink from $43 million to negative $4.9 billion,[136] meaning that consumers would seem to be better off if planning for HumeLink and construction for Snowy 2.0 ceased immediately.
Likewise, the Central West Orana Renewable Energy Zone (REZ) Transmission Link and the Western Renewables Link are considered locked in by the ISP model since they have been granted regulatory approval, pushing up the value of HumeLink and VNI West.[137] The Western Renewables Link has undergone the RIT-T[138] but without VNI West, it would not have been worth building since it needs VNI West to connect Melbourne to the grid.[139] The interdependent nature of these projects means treating one as a sunk cost will inflate the value of the other, making it impossible to determine whether building both is cost-effective. Worse is the treatment of the Central West Orana REZ Link as a sunk cost, given it has not undergone the RIT-T[140] and is crucial for connecting the REZ to HumeLink and VNI West, inflating its value further.[141]
Also there is the temptation to expand the capacity of a declared project as much as possible to inflate the value of the transmission links connecting it to the broader grid, since any added capacity will be incorporated into the model at no extra cost. This has already occurred for the Central West Orana REZ Link with the original 3 GW capacity being doubled to 6 GW.
The treatment of committed projects as sunk costs, especially those that have not gone through a rigorous cost-benefit analysis, means the ISP has been prevented from examining an alternative scenario where a whole set of projects (e.g. Snowy Hydro 2.0, HumeLink, and VNI West) are found to be uneconomic and do not proceed. In this scenario, states could have developed their own renewable energy zones, storage and gas firming with less interconnection, saving billions on transmission projects that could then be invested in other parts of the system.
AEMO should not treat projects as locked in with costs sunk simply because a government has committed to them when those projects have not had the full cost-benefit analysis as part of the whole system. All projects for which significant unspent funds remain should be treated as parts of the integrated system that can be added or taken away to find the Optimal Development Path. Without this occurring, governments won’t have accurate information on the relative value of their declared projects to the system and consumers won’t be able to have confidence in the Optimal Development Path serving their long-term interests.
Flaw #6: Cherry-picking data
Large-scale nuclear ignored in favour of cherry-picked SMR costs in GenCost
The Draft 2023-24 GenCost report contains multiple instances of CSIRO cherry-picking data that distorts the report towards finding renewables cheaper than coal and nuclear.
CSIRO cherry-picked an overestimated data point for the cost of SMRs from a single failed project and excluded any data from large-scale nuclear. This cherry-picked data led CSIRO to claim that SMRs (and hence nuclear) were the highest-cost technology explored in the report. This finding was then broadcast by the Minister for Science and Minister for Energy on several media outlets at the end of 2023 as nuclear being more expensive than wind and solar.[143]
GenCost used overnight construction costs, excluding financing, for all technologies[144] except SMRs. The value used for SMR costs (around $A30,500 per kW)[145] was taken from the $US9.3 billion total project cost, including financing, for the cancelled 462MW UAMPS project.[146] This inflates the cost of SMRs because it is the only technology that erroneously had financing costs included in the cost estimates.
The American UAMPS project was the only data point used for nuclear energy cost estimates, with large-scale nuclear entirely excluded from the analysis despite this issue being raised by multiple stakeholders. GenCost claims stakeholders advised that small modular reactors are the appropriate nuclear technology for Australia, eventhough the report admits large-scale nuclear plants are currently lower cost than SMRs.[147] However, a consultation webinar for GenCost revealed that the decision to exclude large-scale nuclear was based on an industry group workshop in 2018 where no nuclear experts were present.[148] CSIRO claims to have not received a lot of feedback that this was the wrong decision[149] despite the fact that stakeholders with nuclear expertise raised concerns over exclusion of large-scale nuclear.[150]
SMRs are not the only — or necessarily even the most suitable — form of nuclear energy plant for Australia. The Australian Nuclear Association has stated that South Korea’s large-scale APR1000+ pressurised water reactor is not only suitable for installation in Australia but is the lowest risk option with the best value for money.[151]
It is clear AEMO and CSIRO have not spent as large an amount of their resources on nuclear as they have on other technologies due to the current legislative ban.[152] However, given the likely suitability of large-scale nuclear for the Australian grid, adequate resources should be allocated to costing this technology understanding legislation may change. As former ANSTO Director of Engineering, Barrie Hill, stated in his 2023 submission to GenCost: “Current legislated nuclear power prohibitions should in no way compromise rigorous and professional investigation by CSIRO for planning level documents.”[153]
CSIRO needs to include large-scale nuclear and use more than a single overestimated data point in its cost estimates if it is to draw any meaningful conclusions around the comparative costs of renewables and nuclear. Recently completed large-scale nuclear plants in multiple countries should be analysed to provide an accurate estimate for nuclear energy in Australia. This will prevent the current problem of GenCost’s findings being misleadingly communicated as showing nuclear plants as more expensive than renewables when a rigorous analysis has not been conducted.
Coal and gas fuel cost estimates cherry-picked from Ukraine price rise in GenCost
CSIRO has cherry-picked coal and gas price estimates in such a way that the current price spikes due to the Ukraine war are assumed to be locked in for the lifetime of new-build coal and gas plants.
CSIRO uses a different method for calculating ‘low’ and ‘high’ assumptions for the GenCost black coal price estimates. The low assumption for each year has been calculated by taking the average of the individual coal plant’s ‘low price’ values from the Inputs, Assumptions and Scenarios Report (IASR) for the 2024 ISP, while the high assumption appears to have been taken as the maximum individual value for that year (with the 2050 high assumption instead taking the even higher 2040 maximum) (Table 4).
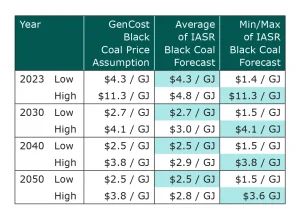
Table 4. GenCost low and high black coal price assumptions showing the matching average or minimum/maximum of IASR black coal price forecasts for each year.[154]
This is inconsistent with the method used for calculating gas prices, for which GenCost uses the more balanced approach of taking the IASR’s minimum individual new-build cost as their low assumption and the maximum individual new-build cost as their high assumption.[155] Though the IASR does not provide new-build cost estimates for coal, GenCost could have used the minimum and maximum values from the IASR’s existing generator estimates for its low and high assumptions respectively. Alternately, they could have averaged the IASR’s ‘low price’ values and ‘high price’ values.
This approach artificially inflates the lower range of coal price assumptions underpinning the LCOE estimates. This is noticeable in the 2023 prices, where $4.30 per GJ has been taken as the low assumption, which represents a Ukraine war price spike that is three times higher than the minimum individual price for that year (i.e. $1.43 per GJ at Millmerran).[156]
The LCOE methodology also cherry-picks Ukraine war price spikes for gas and coal by assuming a gas or coal plant built in 2023 would operate with those prices over its life. Despite the IASR predicting a drop in fuel prices (particularly for coal) over the next several years,[157] the GenCost LCOE model locks in the inflated 2023 fuel prices throughout the economic life of coal and gas plants built in that year. Table 5 shows the fall in both the low and high assumptions for black coal and gas from 2023 to 2030 in GenCost’s model. So locking in the extreme 2023 prices disadvantages coal and gas by disproportionately increasing their LCOE compared to renewables such as wind and solar that have no fuel costs.
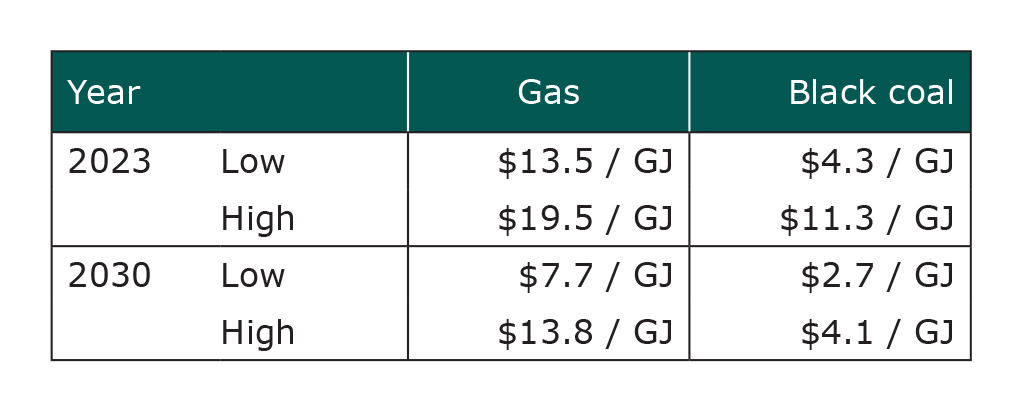
Table 5. GenCost’s low and high assumptions for gas and coal prices in 2023 and 2030.[158]
CSIRO has contended that “to get to the lower range in black coal and gas, you sort of have to have everything go right, a really good capacity factor, a really good fuel contract…”[159] This assertion is false, because correcting only one issue with GenCost’s analysis is enough to make coal cost-competitive with renewables. This is seen in Figure 11 in which a consistent method for coal prices is used (i.e. taking the minimum and maximum coal fuel prices for the low and high assumptions, respectively) which avoided the Ukraine war price spike (i.e. by using 2030 coal fuel prices), resulting in the 2023 LCOE for black coal being on par with GenCost’s renewables LCOEs. Given the problems with the renewables integration analysis in GenCost (see Flaw#1: Outscoping costs), the lack of consideration given to coal plant refurbishment and the assumptions around new-build coal plants (outlined in the following subsection), the lower bound of coal would be considerably cheaper than integrated renewables once all issues were resolved. This accords with the electricity price history in Australia with electricity prices increasing as coal accounts for less and renewables account for more of the grid capacity.[160]
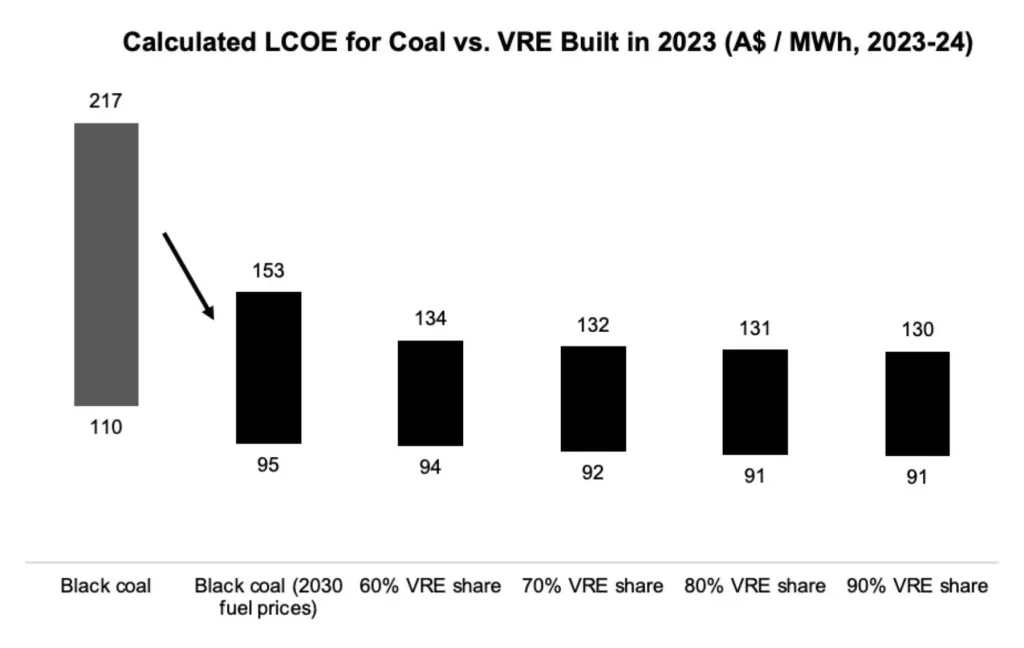
Figure 11. 2023 LCOE calculations for black coal, showing GenCost’s original values and our recalculation, and GenCost’s 2023 LCOE calculations for increasing shares of Variable Renewable Energy (VRE). The recalculated black coal LCOE uses GenCost’s methodology, with 2030 coal fuel prices representing the minimum and maximum values from the 2023 IASR.
CSIRO should be consistent in its calculation of lower and upper limits for coal fuel prices. It should also incorporate the IASR’s fuel price projections over the relevant decades in its LCOE estimates to accurately reflect the prices coal and gas plants are likely to face throughout their lifetime, not just the year they are built. This will prevent rare events such as war-induced price spikes being used to artificially inflate the coal and gas LCOEs.
Unrealistic new-build coal plant costs in GenCost
GenCost’s assumptions about construction costs for new-build coal plants reinforce the illusion that they are more expensive than renewables.
GenCost assumes a new coal plant would be built on a greenfield site[161] and would require a dedicated 50-100km rail line.[162] The total estimated costs of land acquisition and development ($628 million) and the rail line ($210 million) are over $800 million.[163] In reality, the majority of these costs would be unnecessary, as a coal plant is far more likely to be built on or next to an existing coal plant site with an existing link to a coal mine.
GenCost also uses the most expensive coal plant design available. Instead of using the latest coal plant design built in Australia — i.e. the well-proven supercritical pulverised coal technology[164] — the report assumes a new-build coal plant would use advanced ultra-supercritical pulverised coal technology.[165] This would operate under unprecedented steam pressures and temperatures and is yet to be built anywhere globally, let alone in Australia.[166]
The reason for choosing this highly-efficient but more expensive coal plant design appears to be because advanced ultra-supercritical plants are currently being proposed in other countries.[167] However, as electrical engineer Ben Beattie has pointed out,[168] fuel efficiency is less important in the Australian context since plants are typically built near a mine with plentiful coal reserves. This means building a less efficient plant with lower construction costs will generally be cheaper overall.
GenCost’s total costs for a new-build coal plant — even excluding unrealistic land, development and rail costs, come to $3.1 billion — almost double the cost on a per-GW basis of the roughly $1.8 billion (in 2024 dollars) relatively recent super-critical coal plant at Kogan Creek.[169] Combined with the unrealistic assumptions around fuel prices, these assumptions push up the price of coal compared to other technologies, especially wind and solar.
In order to fairly compare coal with other technologies, CSIRO should base their coal plant cost assumptions on a more realistic plant in the Australian context i.e. a supercritical plant on or near an existing site.
Modelled delivery year different from actual delivery year for projects in ISP
AEMO cherry-picks certain future years in which transmission projects, such as HumeLink, show greater benefits in their cost-benefit analysis then uses this to justify the project going ahead as soon as possible in an entirely different year.
The Draft 2024 ISP model has made unusual assumptions about HumeLink’s delivery timeline. TransGrid, HumeLink’s project proponent, is committed to delivering the project by July 2026, based on the 2022 ISP’s cost benefit analysis; which assumed HumeLink would be delivered in 2026-27.[170] Yet in the Draft 2024 ISP, AEMO has not included any development path in which HumeLink is progressed in 2026-27 — all paths assume delivery in 2029-30 or later. Furthermore, the TOOT analysis, which determines the costs and benefits of delivering a project at a particular time, assumes HumeLink is delivered in 2029-30; meaning no cost-benefit analysis has been performed on its currently anticipated delivery date. In fact, the way AEMO has written their methodology allows them to choose any year between 2026-27 and 2032-33 to model HumeLink’s costs and benefits and therefore support the claim it should proceed immediately for delivery in 2026-27.[171]
This cherry-picking of certain years questions HumeLink’s purported benefits. AEMO claims implementing HumeLink would yield $1 billion in market benefits by deferring the construction of 1.2 GW of gas plants, 500 MW of pumped hydro and 1.2 GW of onshore wind otherwise needed to boost capacity by 2026-27 as NSW coal plants are aggressively decommissioned to meet carbon targets.[172] However, CIS calculations indicate that if the actual 2026-27 delivery date were assumed in the cost-benefit analysis instead of 2029-30, these benefits would greatly reduce from $1 billion to just $483 million (Figure 12).
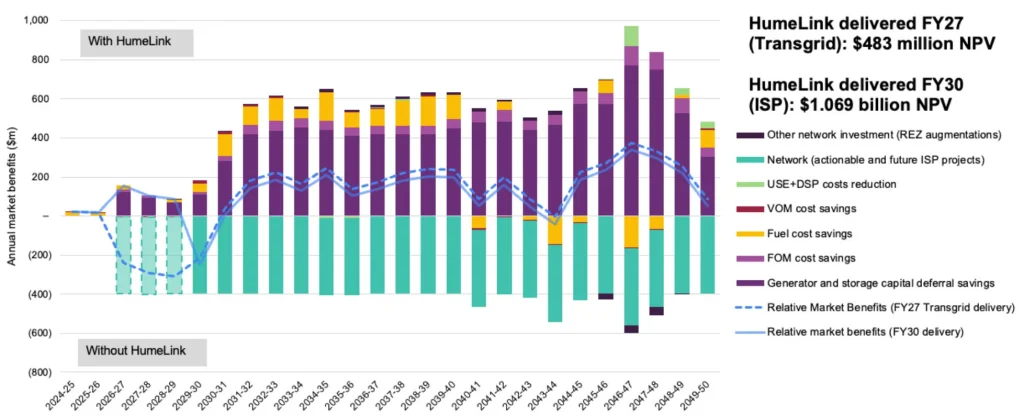
Figure 12. Net present value of HumeLink based on ISP model (delivered in 2029-30) versus recalculated net present value of HumeLink delivered at Transgrid’s planned in-service date (2026-27).[173]
This occurs because the modelling of HumeLink in 2029-30 perfectly aligns with three key events that increase HumeLink’s value (Figure 13). First, Snowy 2.0 is delivered in 2028-29.[174] HumeLink has been described as the “plug” (along with VNI West) that connects this pumped hydro storage capacity to the rest of the grid.[175] The planned delivery date of 2026-27 means HumeLink will not be able to connect Snowy 2.0 to the grid for two more years, making the project much less valuable compared to a 2029-30 delivery when Snowy 2.0 is already online.
Second, VNI West comes online in 2029-30.[176] This project connects Victoria to NSW, greatly increasing the generation capacity to which HumeLink has access.[177] Once again, when HumeLink is assumed to come online in 2026-27 as planned, it is not able to take advantage of the extra capacity in Victoria available through VNI West. By shifting the modelled date to 2029-30, AEMO has ensured the modelled benefits include those arising from VNI West’s existence.
Third, by modelling HumeLink in 2029-30 and no later, AEMO has ensured the project is available just in time to support extra transmission during a bad solar year. There is a dip in solar capacity factors across many solar farms in 2030-31 that appears to represent a La Niña year in the weather modelling (Figure 9 in Flaw#4). AEMO could have modelled HumeLink as coming online in 2031-32, but this would have reduced its benefits compared to being modelled as available during the La Niña year in 2030-31.
Therefore, 2029-30 appears to have been cherry-picked as the date for modelling HumeLink because its perfect timing with the delivery of Snowy 2.0, VNI West and a La Niña year means the project’s calculated benefits are much greater than when the expected delivery date of 2026-27 is modelled.
AEMO should model their proposed timing of HumeLink being delivered in 2026-27 when determining the project’s benefits. There is no way of knowing the true costs and benefits of the current project timeline if an entirely different delivery timeline is modelled instead.
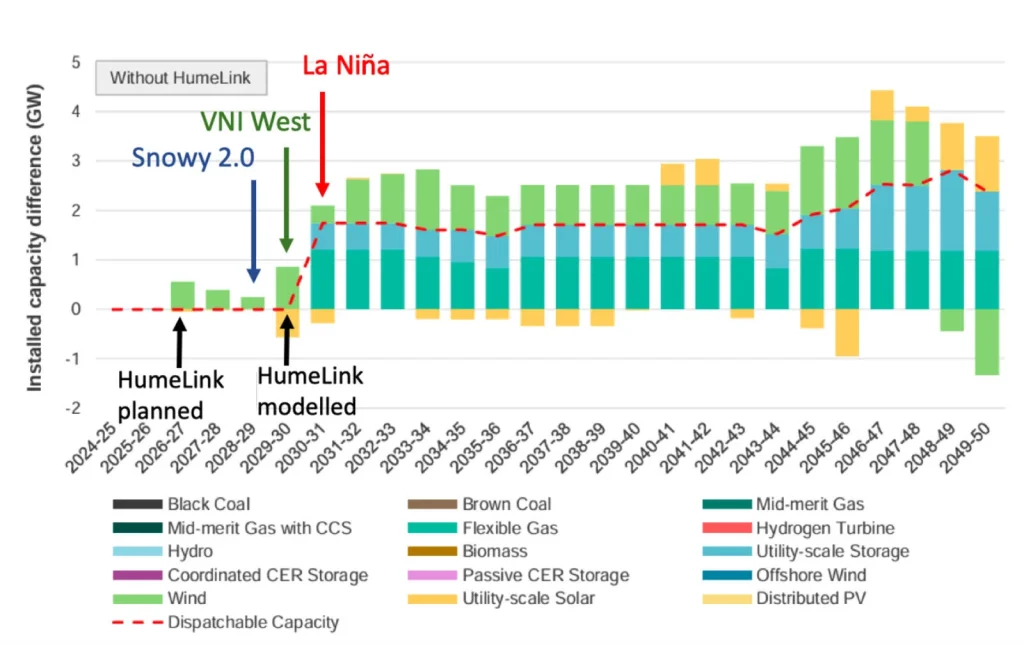
Figure 13. Installed capacity of grid in Step Change scenario with HumeLink delivered in 2029-30, showing key events in modelled timeline.
Years with potential reliability breaches ignored in ISP
AEMO’s reliability analysis cherry-picks years that have no reliability breaches and ignores years in which a breach is likely to occur.
AEMO tested reliability for four years of their model: 2029-30, 2034-35, 2039-40 and 2044-45.[179] However, they failed to test any years in the late 2040s when a reliability breach is likely to occur. This risk is indicated by the cost-benefit analysis showing an increase in costs arising from demand-side participation (DSP) and unserved energy (USE) in the years 2046-47 to 2049-50 (Figure 14).
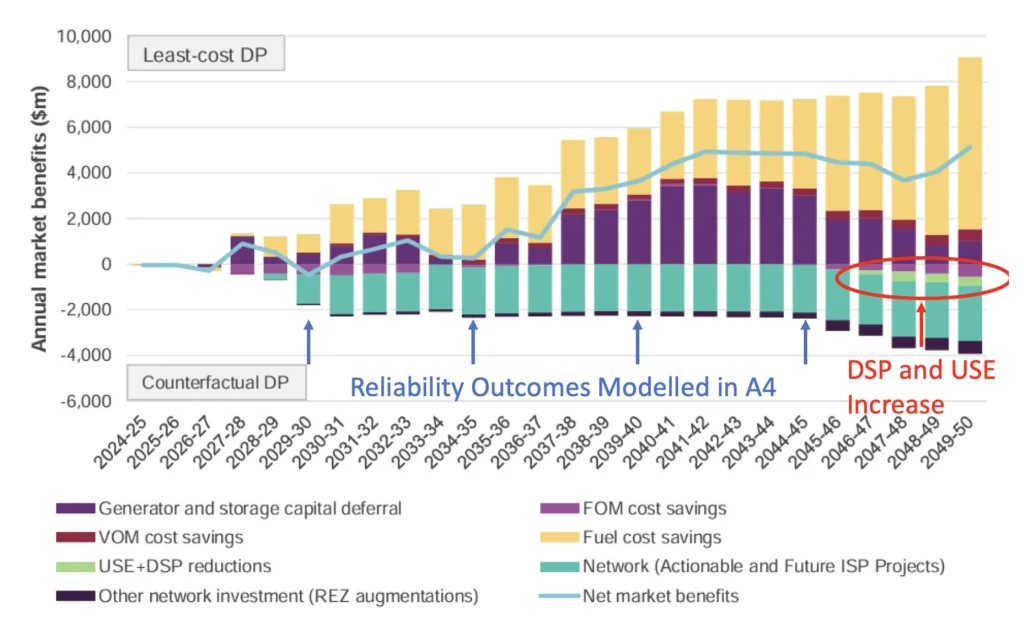
Figure 14. Net market benefits of the least-cost Development Path relative to the counterfactual Development Path under Step Change, with years sampled for reliability analysis indicated.
DSP occurs when energy users voluntarily reduce their energy use during periods of high demand and low supply, while USE is the failure of supply to meet demand experienced as a blackout. Although it is unclear how much DSP versus USE is assumed in the cost-benefit analysis, their increase in the years following those sampled by AEMO’s reliability analysis is concerning. If all years were properly tested for reliability, it is unclear whether AEMO’s model would meet the required threshold even with perfect foresight of weather being assumed (see Flaw #4 Overfitting the model).
AEMO should rigorously test all years of modelling to ensure reliability requirements are met.
Recommendations summary
GenCost should:
- Either conduct a comprehensive assessment of total system costs, as faced by consumers (or taxpayers), at varying levels of renewables penetration, or limit the analysis to only costs faced by an investor (i.e. excluding transmission costs) and clarify that GenCost does not provide evidence for a renewables-dominated system being cheaper for consumers;
- Include large-scale nuclear and use more than a single overestimated data point for SMRs;
- Be consistent in the method of calculating lower and upper bounds for coal fuel prices and incorporate realistic projections of fuel prices likely to be faced by a plant over its lifetime; and
- Base coal plant cost assumptions on a more realistic type of plant for the Australian context.
The ISP should:
- Co-optimise CER and model it as a system cost — including capital, installation, maintenance, incentives to encourage uptake and behavioural shifts in charging, and distribution network upgrades;
- Include the estimated costs of disposal and recycling for all wind turbines, solar panels and batteries, including CER, in the model;
- Include modelling of Scope 3 emissions to account for the carbon intensity of the grid where generation and storage technologies are manufactured;
- Include a scenario with no policy constraints as a counterfactual and incorporate a range of scenarios partly fulfilling, reaching, and exceeding committed targets to understand the true costs of different alternatives;
- Test the forecast grid capacity against a range of potential weather sequences;
- Treat interdependent projects as subsystems when assigning value so that credible system alternatives (such as removing Snowy 2.0, HumeLink and VNI West) can be tested;
- Treat all projects for which unspent funds remain as parts of the system that are optimisable;
- Model project benefits for the year in which the project is scheduled to be delivered; and
- Rigorously test all modelled years to ensure reliability requirements are met.
Conclusion
If Australian governments are to attain cheap, clean and reliable energy, they need trustworthy and accurate information on the costs and benefits of different pathways. As it stands, CSIRO and AEMO have produced analyses with fundamental flaws that fail to support the message for which they are commonly used as evidence. This erroneous message is that wind and solar are cheap sources of energy and a renewables-dominated grid will not only allow us to reach net zero emissions while maintaining reliability but will be cheaper than any alternative, including the fossil-fuelled status quo.
CSIRO’s claims that everything has to go right for coal to be cost-competitive with integrated renewables today can be overturned with a single correction (i.e. not cherry-picking Ukraine War-era fuel prices). With just this single correction, CSIRO’s methodology would show coal to be very competitive with renewables.
If any further corrections are made to the GenCost modelling — such as permitting refurbishments of existing coal plants or using a more realistic type of new-build coal plant — coal would be revealed as being considerably cheaper than integrated renewables which is consistent with the historical evolution of prices Australians are now experiencing.
If AEMO is to find the lowest-cost transmission plan for consumers there is no reason not to model costs for major projects at the same year which they are to come online. However, if AEMO did so, it would reveal that a substantial delay for key projects such as HumeLink is undoubtedly in the interest of consumers. The ISP’s failure to use an objective and logical analysis in determining the costs and benefits of projects is serious as is the consistent failure to treat Snowy 2.0 and its connecting transmission as an inseparable sub-system when considering overall economic benefits.
If we were truly building the most cost-effective version of a renewables-dominated grid an objective analysis would show the current projects are beneficial. Instead, the ISP’s incorrect analysis raises serious doubts over the objectivity and credibility of Australia’s most fundamental energy planning document.
Transitioning to a net zero economy will not be cost-free. In the long term, nuclear energy built efficiently at scale, and allowed to recoup the up-front investment over many years, may indeed prove the most economical of all generation sources.
But in the near term, it seems likely that the transition to net zero will incur greater costs for both nuclear or renewable options than has been provided by very cheap coal-powered generation which Australians have relied upon for many years.
There is need for a mature debate around what that additional cost will be under a renewables-dominated system or a nuclear-dominated system. The debate needs to consider not just the initial cost but also seriously weigh the other attributes of the system. What recurrent re-investment is required to keep the system going? Are there prospects that it will become more economical in the long term? Will it be reliable? What difficulties will we have in disposing or recycling waste? What will be the impact on nature and the rural landscape?
The current debate is undermined by CSIRO and AEMO producing flawed analyses that have allowed the government to maintain a pretence that this debate is an unnecessary distraction. By allowing the persistent defence of the proposition that a reliable renewables-based system is cheaper than the status quo, as well as nuclear, the prospect of a mature and civil debate has been reduced. AEMO and CSIRO should correct the flaws in their analysis to allow the energy debate Australians desperately need to have.
[1] Parkinson, Giles. “Gas Led Calamity: The Shocking Failure of Australia’s Climate Efforts over Two Decades.” Renew Economy, August 28, 2023. https://reneweconomy.com.au/gas-led-calamity-the-shocking-failure-of-australias-climate-efforts-over-two-decades/.
[2] Janda, Michael. “Nuclear ‘Bulldust’: Forrest Slams Coalition and Fossil Fuel Industry for Promoting ‘Fairy Godmother’ Approach to Clean Energy.” ABC News, February 26, 2024. https://www.abc.net.au/news/2024-02-26/andrew-forrest-slams-fossil-fuel-industry-nuclear-distraction/103512770.
[3] Van Leeuwen, Hans. “Inside the Coalition’s nuclear crusade at COP28.” Australian Financial Review, December 10, 2023. https://www.afr.com/policy/energy-and-climate/inside-the-coalition-s-nuclear-crusade-at-cop28-20231210-p5eqbt.
[4] Bowen, Chris. “Five serious answers why nuclear is the wrong solution for Australia.” Australian Financial Review, August 29, 2023. https://www.afr.com/policy/energy-and-climate/five-serious-answers-why-nuclear-is-the-wrong-solution-for-australia-20230827-p5dzqa.
[5] Driver, George. “Are Renewables the Cheapest New Source of Power?”. Australian Associated Press, February 11, 2021. https://www.aap.com.au/factcheck/are-renewables-the-cheapest-new-source-of-power/; Legislative Council Environment and Planning Committee. “Inquiry into nuclear prohibition: Simon Holmes à Court – Transcript.” September 11, 2020. https://www.parliament.vic.gov.au/490af0/contentassets/d75851cf7dfd4cefb759f82939b7d28b/2.-final-simon-holmes-a-court.pdf.
[6] Bowen, Chris. “Five serious answers why nuclear is the wrong solution for Australia.” Australian Financial Review, August 29, 2023. https://www.afr.com/policy/energy-and-climate/five-serious-answers-why-nuclear-is-the-wrong-solution-for-australia-20230827-p5dzqa.
[7] Driver, George. “Are Renewables the Cheapest New Source of Power?”. Australian Associated Press, February 11, 2021. https://www.aap.com.au/factcheck/are-renewables-the-cheapest-new-source-of-power/; Legislative Council Environment and Planning Committee. “Inquiry into nuclear prohibition: Simon Holmes à Court – Transcript.” September 11, 2020. https://www.parliament.vic.gov.au/490af0/contentassets/d75851cf7dfd4cefb759f82939b7d28b/2.-final-simon-holmes-a-court.pdf.
[8] Graham, Paul, Jenny Hayward, and James Foster. 2023. GenCost 2023-24: Consultation Draft. Australia: CSIRO. https://www.csiro.au/-/media/Energy/GenCost/GenCost2023-24Consultdraft_20231219-FINAL.pdf.
[9] Draft 2024 Integrated System Plan. 2024. Australian Energy Market Operator. https://aemo.com.au/-/media/files/stakeholder_consultation/consultations/nem-consultations/2023/draft-2024-isp-consultation/draft-2024-isp.pdf?la=en.
[10] CSIRO. “2023-24 GenCost Consultation Draft Released.” December 21, 2023. https://www.csiro.au/en/news/all/news/2023/december/2023-24-gencost-consultation-draft–released.
[11] CSIRO. “2023-24 GenCost Consultation Draft Released.” December 21, 2023. https://www.csiro.au/en/news/all/news/2023/december/2023-24-gencost-consultation-draft–released.
[12] AEMO. “Integrated System Plan (ISP).” 2024. https://aemo.com.au/en/energy-systems/electricity/national-electricity-market-nem/nem-forecasting-and-planning/integrated-system-plan-isp.
[13] AEMO. “Draft 2024 ISP Consultation.” December 15, 2023. https://aemo.com.au/consultations/current-and-closed-consultations/draft-2024-isp-consultation.
[14] Draft 2024 ISP. p 3.
[15] Pack, Eli. “AEMO slams Murdoch media campaign that claims renewables are not low cost,” LinkedIn, 8 Aug 2023, 12:07. https://www.linkedin.com/posts/elijahpack_aemo-slams-murdoch-media-campaign-that-claims-activity-7094650317497143296-c-Wf?utm_source=share&utm_medium=member_desktop.
[16] AEMO. 2024. “2023-24 Draft GenCost Webinar.” 8:00. https://aemo.com.au/consultations/current-and-closed-consultations/2024-forecasting-assumptions-update-consultation.
[17] CSIRO. “Statement on GenCost.” July 29, 2023. https://www.csiro.au/en/news/All/News/2023/July/Statement-on-GenCost.
[18] GenCost, p ix.
[19] CSIRO. “Understanding the Cost of Australia’s Energy Transition.” October 5, 2023. https://www.csiro.au/en/news/All/Articles/2023/October/Gencost-explainer.
[20] CSIRO. “Understanding the Cost of Australia’s Energy Transition.” October 5, 2023. https://www.csiro.au/en/news/All/Articles/2023/October/Gencost-explainer.
[21] GenCost, p 56.
[22] GenCost, p 60
[23] GenCost, p 58.
[24] CSIRO. “Understanding the Cost of Australia’s Energy Transition.” October 5, 2023. https://www.csiro.au/en/news/All/Articles/2023/October/Gencost-explainer.
[25] Brinkman, Gregory, Dominique Bain, Grant Buster, Caroline Draxl, Paritosh Das, Jonathan Ho, Eduardo Ibanez, et al. 2021. The North American Renewable Integration Study: A U.S. Perspective. Golden, CO: National Renewable Energy Laboratory. https://www.nrel.gov/docs/fy21osti/79224.pdf; Clack, Christopher, Aditya Choukulkar, Brianna Coté, and Sarah Mckee. 2020. A New Roadmap for the Lowest Cost Grid. Boulder, CO: Vibrant Clean Energy. https://www.vibrantcleanenergy.com/wp-content/uploads/2020/12/WhyDERs_TR_Final.pdf; Cole, Wesley, J Vincent Carag, Maxwell Brown, Patrick Brown, Stuart Cohen, Kelly Eurek, et al. 2021. 2021 Standard Scenarios Report:
A U.S. Electricity Sector Outlook. Golden, CO: National Renewable Energy Laboratory. https://www.nrel.gov/docs/fy22osti/80641.pdf.
[26] CSIRO. 2023. “GenCost: Annual insights into the cost of future electricity generation in Australia.” https://www.csiro.au/en/research/technology-space/energy/Energy-data-modelling/GenCost.
[27] GenCost, p 58.
[28] 2022 ISP, pp 66-67.
[29] GenCost, p 58.
[30] AEMO. 2024. “2023-24 Draft GenCost Webinar.” 1:27:30. https://aemo.com.au/consultations/current-and-closed-consultations/2024-forecasting-assumptions-update-consultation.
[31] GenCost, p 58.
[32] GenCost, p 59.
[33] GenCost, p 60.
[34] AEMO. 2024. “2023-24 Draft GenCost Webinar.” 52:07. https://aemo.com.au/consultations/current-and-closed-consultations/2024-forecasting-assumptions-update-consultation.
[35] In the 2022 ISP Final Results Workbook, 60% VRE (excluding rooftop solar) is reached in 2028-29, while 90% VRE is reached in 2040-41, for the Optimal Development Path under the Step Change scenario. The difference between the coordinated Distributed Energy Resources and grid-scale battery depth required in these years is 78 GWh. Based on the 2023-24 GenCost estimates, this amounts to approximately $55 billion worth of batteries, taking the 2023 average battery cost of roughly $700/kWh. The amount of energy generated by variable renewable sources goes from 113 to 228 TWh between 2028-29 and 2040-41, almost exactly doubling output (accounting for curtailment). Taking the capital cost of storage required at 60% and 90% variable renewables share and dividing it by the non-rooftop solar VRE generation at these VRE shares shows the ratio between capital cost and VRE output increases from $0.19 billion/TWh at 60% to over $0.33 billion/TWh at 90%. Although this analysis excludes operating costs that would be included in the LCOE, opex is very low compared to capex for batteries and pumped hydro, especially considering batteries need to be replaced every 15 or so years. Including opex would likely push the cost of storage even higher at 90%, since there will be a much higher proportion of batteries than pumped hydro compared to the proportion at 60%.
[36] Bowen, Chris (@Bowenchris). “Renewable energy is the cheapest form of energy, but often gets unfairly blamed for higher electricity prices.” X, Aug 26, 2023, 8:06 AM. https://twitter.com/Bowenchris/status/1695195850606051820.
[37] “Draft 2024 Integrated System Plan publication webinar part 2.” 2023. YouTube. 1:15. https://youtu.be/uxDBxhsZXGc.
[38] Draft 2024 ISP, p 14.
[39] AEMO. 2023. “Draft 2024 ISP Webinar”. https://aemo.com.au/-/media/files/major-publications/isp/2023/draft-2024-isp-publication-webinar-presentation.pdf?la=en.
[40] Draft 2024 ISP, p 10.
[41] 86 GW of distributed PV capacity and 157 GWh of passive and coordinated CER storage energy is required in 2049-50 according to the 2024 Draft ISP results workbook – Step Change. According to the Draft 2023-24 GenCost report, rooftop solar panels cost $1505/kW in 2023 and home batteries cost $1455/kWh. Costs for rooftop solar are therefore around $129 billion and for home batteries around $229 billion, totalling $358 billion.
[42] 55 GW of utility-scale solar capacity, 8 GWh of shallow storage energy, 28 GWh of medium storage energy and 51 GWh of deep storage energy is required in 2049-50 according to the 2024 Draft ISP results workbook – Step Change. According to the Draft 2023-24 GenCost report, utility-scale solar costs $1526/kW in 2023, shallow storage costs $870/kWh (averaging the 1 and 2 hour battery costs of $1009/kWh and $731/kWh), medium storage costs $530/kWh (averaging the 4, 8 and 12 hour battery costs of $592/kWh, $519/kWh and $478/kWh) and deep storage (24 hours) costs $427/kWh. Costs for utility-scale solar are therefore around $84 billion, for shallow storage $7 billion, for medium storage $15 billion, and for deep storage $22 billion, totalling $128 billion.
[43] “Draft 2024 Integrated System Plan publication webinar part 2.” 2023. YouTube. 3:15. https://youtu.be/uxDBxhsZXGc.
[44] AEMO. 2022. “Forecasting Approach – Electricity Demand Forecasting Methodology”. p 65. https://aemo.com.au/-/media/files/electricity/nem/planning_and_forecasting/nem_esoo/2022/forecasting-approach-electricity-demand-forecasting-methodology.pdf?la=en&hash=4620DDB841C4D61C0E63B2E95754AB9C.
[45] AEMO. 2022. Forecasting Approach – Electricity Demand Forecasting Methodology. p 66. https://aemo.com.au/-/media/files/electricity/nem/planning_and_forecasting/nem_esoo/2022/forecasting-approach-electricity-demand-forecasting-methodology.pdf?la=en&hash=4620DDB841C4D61C0E63B2E95754AB9C.
[46] 2023 IASR, p 27.
[47] Department of Treasury and Finance. 2023. “Incentives for electric vehicles.” Government of South Australia. https://www.treasury.sa.gov.au/Growing-South-Australia/incentives-for-electric-vehicles.
[48] “Draft 2024 Integrated System Plan publication webinar part 1.” 2023. YouTube. 26:44. https://www.youtube.com/watch?v=WUrvCioP5-s
[49] AEMO. 2023. “Project EDGE Final report Version 2.” p 41. https://aemo.com.au/-/media/files/initiatives/der/2023/project-edge-final-report.pdf?la=en.
[50] AEMO. 2023. “Project EDGE Final report Version 2.” p 87. https://aemo.com.au/-/media/files/initiatives/der/2023/project-edge-final-report.pdf?la=en.
[51] 2021 IASR workbook, Battery & Plug-in EVs tab.
[52] Draft 2024 ISP, p 34.
[53] Lavieri, Patrícia and Gabriel Oliveira. 2021. “Electric Vehicle Charging Consumer Survey: Insights Report. University of Melbourne.” https://www.researchgate.net/publication/355444278_Electric_Vehicle_Charging_Consumer_Survey_Insights_Report.
[54] Energeia. 2020. “Distributed Energy Resources Enablement Project – Discussion and Options Paper”. https://renew.org.au/wp-content/uploads/2020/06/Energeia.pdf.
[55] AEMO. 2023. “Draft 2024 ISP Webinar”. https://aemo.com.au/-/media/files/major-publications/isp/2023/draft-2024-isp-publication-webinar-presentation.pdf?la=en.
[56] Hughson, Bev, Craig Memery, Mark Grenning and Mark Henley. 2023. “ISP Consumer Panel Report on AEMO’s Inputs Assumptions and Scenarios Report (IASR) for the 2024 Integrated System Plan – Final Report”. 2024 ISP Consumer Panel. https://aemo.com.au/-/media/files/major-publications/isp/2023/isp-consumer-panel-report-on-2023-iasr.pdf?la=en.
[57] Bowen, Chris. “Energy Market Operator shows firmed renewables the path for a cleaner, cheaper, more reliable grid.” December 15, 2023. Commonwealth of Australia. https://minister.dcceew.gov.au/bowen/media-releases/energy-market-operator-shows-firmed-renewables-path-cleaner-cheaper-more-reliable-grid.
[58] Bowen, Chris. 2024. “Interview with David Speers, ABC Insiders.” Department of Climate Change, Energy, the Environment and Water. March 10, 2024. https://minister.dcceew.gov.au/bowen/transcripts/interview-david-speers-abc-insiders-1.
[59] Draft 2023-24 GenCost, p 25, 48; Aurecon. 2023. “2023 costs and technical parameter review.” https://aemo.com.au/-/media/files/stakeholder_consultation/consultations/nem-consultations/2023/2024-forecasting-assumptions-update-consultation-page/aurecon—2023-cost-and-technical-parameters-review.pdf?la=en
[60] Ausgrid. 2023. Tariff Structure Statement Compliance Document. https://www.aer.gov.au/system/files/2023-12/Ausgrid%20-%20Revised%20proposal%20-%20Att.%208.1%20-%20Tariff%20Structure%20Statement%20compliance%20document%20%28pdf%29%20-%2030%20Nov%202023%20-%20Public.pdf.
[61] “Draft 2024 Integrated System Plan publication webinar part 1.” 2023. YouTube. 27:48. https://www.youtube.com/watch?v=WUrvCioP5-s
[62] “Draft 2024 Integrated System Plan publication webinar part 2.” 2023. YouTube. 11:03. https://youtu.be/uxDBxhsZXGc.
[63] GHD. 2018. “AEMO costs and technical parameter review.” https://aemo.com.au/-/media/Files/Electricity/NEM/Planning_and_Forecasting/Inputs-Assumptions-Methodologies/2019/9110715-REP-A-Cost-and-Technical-Parameter-Review—Rev-4-Final.pdf.
[64] 2023 IASR, p 94.
[65] 2023 IASR, p 94.
[66] Parliament of Australia. 2023. Question on notice no. 102. Portfolio question number: 92. 2020-21 Budget estimates. Environment and Communications Committee, Climate Change, Energy, the Environment and Water Portfolio.
[67] Department of Climate Change, Energy, the Environment and Water. 2023. “Wired for change: Regulation for small electrical products and solar photovoltaic system waste.” https://storage.googleapis.com/files-au-climate/climate-au/p/prj2748908c878a1b4b81a54/public_assets/Wired%20for%20change%20Regulation%20for%20waste%20small%20electrical%20products%20and%20solar%20photovoltaic%20systems.pdf
[68] 2023 IASR Assumptions Workbook, Retirement tab.
[69] 2023 Inputs, Assumptions and Scenarios Report. Emissions Intensity.
[70] Walden, Max. “Trade unions raise alarm over allegations of forced labour in Xinjiang production of solar components.” ABC News, April 21, 2021. https://www.abc.net.au/news/2021-04-21/solar-panels-china-xinjiang-accused-forced-labour-links/100040134.
[71] Schlink, Scott. “Wind turbine manufacturing resumes in Australia.” Holding Redlich, March 18, 2019. https://www.holdingredlich.com/wind-turbine-manufacturing-resumes-in-australia.
[72] Rae, Marion. “Australia has everything battery storage needs, except the ability to make them at scale”. Renew Economy, November 17, 2023. https://reneweconomy.com.au/australia-has-everything-battery-storage-needs-except-the-ability-to-make-them-at-scale/.
[73] Wang, Seaver and Juzel Lloyd. 2022. “Sins of a Solar Empire.” Breakthrough Institute. https://thebreakthrough.imgix.net/Sins-of-Solar_Report_v3.pdf.
[74] 2023 IASR Assumptions Workbook, Emissions intensity tab.
[75] Australian Government Department of Climate Change, Energy, the Environment and Water. 2023. “Australian National Greenhouse Accounts Factors Workbook.” p 5. https://www.dcceew.gov.au/sites/default/files/documents/national-greenhouse-accounts-factors-2022.pdf.
[76] Deloitte. “Scope 1, 2 and 3 emissions.” 2024. https://www2.deloitte.com/uk/en/focus/climate-change/zero-in-on-scope-1-2-and-3-emissions.html.
[77] 2024 Draft ISP results workbook – Step Change. Summary Sheet. “NEM Emissions Trajectory”.
[78] Wang, Seaver and Juzel Lloyd. 2022. “Sins of a Solar Empire.” Breakthrough Institute. https://thebreakthrough.imgix.net/Sins-of-Solar_Report_v3.pdf. See “Solar PV Carbon Payback Period Analysis”.
[79] Capacity factors were derived from the generation outlook files. This was done by taking generated output and dividing it by the installed capacity for each technology. The given numbers are the mean over the modelling period (2024-25 to 2051-52).
[80] Dai, Qiang, Jarod C. Kelly, Linda Gaines, and Michael Wang. 2019. “Life Cycle Analysis of Lithium-Ion Batteries for Automotive Applications” Batteries 5, no. 2: 48. https://doi.org/10.3390/batteries5020048.
[81] 2023 IASR Assumptions Workbook, Fixed OPEX tab.
[82] The ISP does not make assumptions around consumer battery lifespans. We have chosen 15 years as a reasonable estimate (e.g., Tesla Powerwall offers 10-year warranty but in some cases can be used for 20 years).
[83] United Nations Economic Commission for Europe. 2022. “Carbon Neutrality in the UNECE Region.” https://unece.org/sites/default/files/2022-09/Technology%20Interplay_final_2.pdf.
[84] Mariutti. “The Dirty Secret of the Solar Industry.” Substack, 12 April, 2023. https://bfrandall.substack.com/p/the-dirty-secret-of-the-photovoltaic.
[85] ISP, p 3.
[86] Husic, Ed. “GenCost confirms renewables remain the cheapest form of energy, as the cost of nuclear reactors skyrocket.” Department of Industry, Science and Resources. December 21, 2023. https://www.minister.industry.gov.au/ministers/husic/media-releases/gencost-confirms-renewables-remain-cheapest-form-energy-cost-nuclear-reactors-skyrocket.
[87] 2021 Inputs, assumptions and scenarios workbook, Scenarios tab.
[88] 2021 Inputs, assumptions and scenarios workbook, Scenarios tab.
[89] ISP 2022 Consumer Panel. 2021. “ISP Consumer Panel Report on AEMO’s Inputs Assumptions and Scenarios Report (IASR) for the 2022 Integrated System Plan”. p 40. https://aemo.com.au/-/media/files/major-publications/isp/2021/isp-consumer-panel-report-on-2021-iasr.pdf.
[90] 2021 Inputs, Assumptions and Scenarios Report. p 51.
[91] ISP 2022 Consumer Panel. 2021. “ISP Consumer Panel Report on AEMO’s Inputs Assumptions and Scenarios Report (IASR) for the 2022 Integrated System Plan”. p 40. https://aemo.com.au/-/media/files/major-publications/isp/2021/isp-consumer-panel-report-on-2021-iasr.pdf.
[92] AEMO. 2021. “Draft 2022 Integrated System Plan”. https://aemo.com.au/-/media/files/major-publications/isp/2022/draft-2022-integrated-system-plan.pdf.
[93] 2021 Inputs, Assumptions and Scenarios Report. p 6.
[94] According to AEMO’s methodology for the 2022 ISP, the Delphi Panel technique draws on an anonymous panel of up to 10 subject matter experts, both internal and external to AEMO, to rank the relative likelihood of each scenario using a questionnaire. Panel members provide reasoning for their selection. Responses are collected, analysed, common and conflicting views identified, and shared with the panel. Panel members then have the opportunity to modify their original views based on the varying positions of other panel experts, with the goal being to reach consensus where possible. Following this process, a stakeholder workshop provides the opportunity for discussion with a broader range of stakeholders, seeking feedback on the reasonableness of weights proposed through the Delphi technique.
[95] 2022 ISP. p 33.
[96] 2021 Inputs, Assumptions and Scenarios Report. p 5.
[97] ISP 2022 Consumer Panel. 2022. “ISP Consumer Panel Report on AEMO’s Draft 2022 Integrated System Plan”. p 34. https://aemo.com.au/-/media/files/major-publications/isp/2022/isp-consumer-panel-report-on-draft-2022-isp.pdf.
[98] 2020 ISP, p 32; 2022 ISP, p 30.
[99] 2022 ISP. p 33.
[100] ISP 2022 Consumer Panel. 2022. “ISP Consumer Panel Report on AEMO’s Draft 2022 Integrated System Plan”. p 34. https://aemo.com.au/-/media/files/major-publications/isp/2022/isp-consumer-panel-report-on-draft-2022-isp.pdf.
[101] ISP 2022 Consumer Panel. 2022. “ISP Consumer Panel Report on AEMO’s Draft 2022 Integrated System Plan”. p 34. https://aemo.com.au/-/media/files/major-publications/isp/2022/isp-consumer-panel-report-on-draft-2022-isp.pdf.
[102] 2022 ISP. p 33.
[103] ISP 2022 Consumer Panel. 2022. “ISP Consumer Panel Report on AEMO’s Draft 2022 Integrated System Plan”. p 34. https://aemo.com.au/-/media/files/major-publications/isp/2022/isp-consumer-panel-report-on-draft-2022-isp.pdf.
[104] 2021 IASR. p 79.
[105] 2021 IASR workbook, Fuel Price tab.
[106] Draft 2022 ISP. p 57.
[107] 2023 IASR, p 28.
[108] 2022 Final ISP Results Workbook – Slow Change – Updated Inputs, Summary tab.
[109] 2023 IASR, p 6.
[110] 2023 IASR, p 6.
[111] AEMO. 2022. 2023 Preliminary Scenarios – Webinar Feedback. https://aemo.com.au/energy-systems/major-publications/integrated-system-plan-isp/2024-integrated-system-plan-isp/-/media/80b7531d3b1e405f85ff8f88c81f193e.ashx?la=en. p 7-8.
[112] AEMO. 2022. 2023 Preliminary Scenarios – Webinar Feedback. https://aemo.com.au/energy-systems/major-publications/integrated-system-plan-isp/2024-integrated-system-plan-isp/-/media/80b7531d3b1e405f85ff8f88c81f193e.ashx?la=en. p 6.
[113] AEMO. 2022. 2023 Preliminary Scenarios – Webinar Feedback. https://aemo.com.au/energy-systems/major-publications/integrated-system-plan-isp/2024-integrated-system-plan-isp/-/media/80b7531d3b1e405f85ff8f88c81f193e.ashx?la=en. p 8.
[114] AEMO. 2022. 2023 Preliminary Scenarios – Webinar Feedback. https://aemo.com.au/energy-systems/major-publications/integrated-system-plan-isp/2024-integrated-system-plan-isp/-/media/80b7531d3b1e405f85ff8f88c81f193e.ashx?la=en. p 7.
[115] AEMO. 2022. 2023 Preliminary Scenarios – Webinar Feedback. https://aemo.com.au/energy-systems/major-publications/integrated-system-plan-isp/2024-integrated-system-plan-isp/-/media/80b7531d3b1e405f85ff8f88c81f193e.ashx?la=en. p 7.
[116] ISP 2022 Consumer Panel. 2022. “ISP Consumer Panel Report on AEMO’s Draft 2022 Integrated System Plan”. p 34. https://aemo.com.au/-/media/files/major-publications/isp/2022/isp-consumer-panel-report-on-draft-2022-isp.pdf.
[117] ISP 2022 Consumer Panel. 2022. “ISP Consumer Panel Report on AEMO’s Draft 2022 Integrated System Plan”. p 35. https://aemo.com.au/-/media/files/major-publications/isp/2022/isp-consumer-panel-report-on-draft-2022-isp.pdf.
[118] ISP 2022 Consumer Panel. 2022. “ISP Consumer Panel Report on AEMO’s Draft 2022 Integrated System Plan”. p 34. https://aemo.com.au/-/media/files/major-publications/isp/2022/isp-consumer-panel-report-on-draft-2022-isp.pdf.
[119] AEMO. 2023. Appendix 4: System Operability. p 30. https://aemo.com.au/-/media/files/stakeholder_consultation/consultations/nem-consultations/2023/draft-2024-isp-consultation/appendices/a4-system-operability.pdf?la=en.
[120] “Draft 2024 Integrated System Plan publication webinar part 2.” 2023. YouTube. 0:17. https://youtu.be/uxDBxhsZXGc.
[121] Origin Energy. 2024. “Eraring Power Station.” https://www.originenergy.com.au/about/who-we-are/what-we-do/generation/eraring-power-station/.
[122] Draft 2024 ISP results workbook – Step Change, Summary tab, CDP 11 (ODP).
[123] Solar capacity factors calculated using data from Draft 2024 ISP results workbook – Step Change, REZ Generation & REZ Generation Capacity tabs.
[124] 2023 IASR Assumptions Workbook. New Entrant Data Summary tab.
[125] Draft 2024 ISP results workbook – Step Change.
[126] AEMO. 2023. ISP Methodology. p 103-104. https://aemo.com.au/-/media/files/stakeholder_consultation/consultations/nem-consultations/2023/isp-methodology-2023/isp-methodology_june-2023.pdf?la=en.
[127] AEMO. 2023. ISP Methodology. p 103-104. https://aemo.com.au/-/media/files/stakeholder_consultation/consultations/nem-consultations/2023/isp-methodology-2023/isp-methodology_june-2023.pdf?la=en.
[128] Draft 2024 ISP, p 6.
[129] 2024 Draft ISP results workbook – Step Change; AEMO. 2023. “Appendix 6. Cost
Benefit Analysis.” https://aemo.com.au/-/media/files/stakeholder_consultation/consultations/nem-consultations/2023/draft-2024-isp-consultation/appendices/a6-cost-benefit-analysis.pdf?la=en; We have considered the $7.1 billion combined value of SuperGrid South with Gladstone Reinforcement spread across those two projects.
[130] NSW Department of Planning, Industry and Environment. 2020. NSW Electricity Infrastructure Roadmap. https://www.energy.nsw.gov.au/sites/default/files/2022-08/NSW%20Electricity%20Infrastructure%20Roadmap%20-%20Detailed%20Report.pdf.
[131] AER. 2022. Revenue determination guideline for NSW contestable network projects. https://www.aer.gov.au/system/files/Revenue%20determination%20guideline%20for%20NSW%20contestable%20network%20projects%20-%20Final%20-%2019%20August%202022.pdf
[132] Transgrid. 2022. NSW Transmission Annual Planning Report 2022. https://web.archive.org/web/20221115000000*/https://www.transgrid.com.au/tapr.
[133] National Electricity (Victoria) Amendment Act 2020. 16Y Order modifying regulatory arrangements relating to declared transmission system augmentations and related services. 2 (d).
[134] “Draft 2024 Integrated System Plan publication webinar part 1.” 2023. YouTube. 57:52. https://www.youtube.com/watch?v=WUrvCioP5-s.
[135] Vorrath, Sophie. “Australia’s biggest engineering debacle:” Snowy 2.0 costs double again to reported $12bn. Renew Economy, August 30, 2023. https://reneweconomy.com.au/australias-biggest-engineering-debacle-snowy-2-0-costs-double-again-to-reported-12bn/.
[136] Mountain, Bruce, Ted Woodley and Hugh Outhred. 2021. “A review of the HumeLink Project Assessment Conclusions Report.” Victoria Energy Policy Centre. https://vuir.vu.edu.au/42668/1/210916%20FINAL%20HumeLink%20Working%20Paper.pdf.
[137] ISP, p 56.
[138] AEMO. 2024. Western Victorian Regulatory Investment Test for Transmission. https://aemo.com.au/en/initiatives/major-programs/western-victorian-regulatory-investment-test-for-transmission.
[139] AEMO. 2024. Transmission augmentation information. https://aemo.com.au/energy-systems/electricity/national-electricity-market-nem/nem-forecasting-and-planning/forecasting-and-planning-data/transmission-augmentation-information.
[140] Transgrid. 2022. NSW Transmission Annual Planning Report 2022. https://web.archive.org/web/20221115000000*/https://www.transgrid.com.au/tapr.
[141] AEMO. 2024. Transmission augmentation information. https://aemo.com.au/energy-systems/electricity/national-electricity-market-nem/nem-forecasting-and-planning/forecasting-and-planning-data/transmission-augmentation-information.
[142] EnergyCo. 2024. “Central-West Orana Renewable Energy Zone.” https://www.energyco.nsw.gov.au/cwo-rez.
[143] Husic, Ed. “GenCost confirms renewables remain the cheapest form of energy, as the cost of nuclear reactors skyrocket.” Department of Industry, Science and Resources, December 21, 2023. https://www.minister.industry.gov.au/ministers/husic/media-releases/gencost-confirms-renewables-remain-cheapest-form-energy-cost-nuclear-reactors-skyrocket; Readfearn, Graham. “Solar and on-shore wind provide cheapest electricity and nuclear most expensive, CSIRO analysis shows.” The Guardian, December 21, 2023. https://www.theguardian.com/australia-news/2023/dec/21/solar-and-on-shore-wind-provide-cheapest-electricity-and-nuclear-most-expensive-csiro-analysis-shows; Hutchens, Gareth. “Nuclear energy is more expensive than renewables, CSIRO report finds.” ABC, December 21, 2023. https://www.abc.net.au/news/2023-12-21/nuclear-energy-most-expensive-csiro-gencost-report-draft/103253678; Commins, Patrick. Nuclear still most expensive energy, says CSIRO.” The Australian, December 21, 2023. https://www.theaustralian.com.au/business/mining-energy/nuclear-still-most-expensive-energy-says-csiro/news-story/366fdf9f64a13c83176ee64356744153; Parkinson, Giles. “CSIRO says wind and solar much cheaper than nuclear, even with added integration costs.” Renew Economy, December 20, 2023. https://reneweconomy.com.au/csiro-says-wind-and-solar-much-cheaper-than-nuclear-even-with-added-integration-costs/.
[144] GenCost, p 14.
[145] GenCost, p 17.
[146] IEEFA. 2023. “UAMPS Talking Points”. https://ieefa.org/sites/default/files/2023-01/UAMPS%20Talking%20Points%20_%20Class%203%20_%2020230102%20_%20Final.pdf.
[147] GenCost, p 17-18.
[148] AEMO. 2024. “2023-24 Draft GenCost Webinar.” 47:10. https://aemo.com.au/consultations/current-and-closed-consultations/2024-forecasting-assumptions-update-consultation.
[149] AEMO. 2024. “2023-24 Draft GenCost Webinar.” 47:10. https://aemo.com.au/consultations/current-and-closed-consultations/2024-forecasting-assumptions-update-consultation.
[150] Nuclear for Climate Australia. 2021. “Submission to Comment on GenCost”. pp 2–3. https://aemo.com.au/-/media/files/stakeholder_consultation/consultations/nem-consultations/2021/iasr/submissions/nuclear-for-climate.pdf?la=en; Hill, Barrie. 2023. “Submission to Comment on GenCost 23 Draft Document Review”, https://aemo.com.au/-/media/files/stakeholder_consultation/consultations/nem-consultations/2022/2023-inputs-assumptions-and-scenarios-consultation/submissions/barrie-hill.pdf?la=en.
[151] Australian Nuclear Association. 2019. “Submission to House of Representative Standing Committee on Environment and Energy Inquiry on the Prerequisites for Nuclear Energy in Australia.” pp 16–17. https://www.aph.gov.au/DocumentStore.ashx?id=19c3f5cc-7969-4a49-902f-49fe590166e6&subId=669910.
[152] Parliament of Australia. 2019. “Standing Committee on the Environment and Energy: Prerequisites for nuclear energy in Australia.” https://parlinfo.aph.gov.au/parlInfo/search/display/display.w3p;db=COMMITTEES;id=committees%2Fcommrep%2F3abfb90c-9215-4b65-a5d2-32d112e8cd46%2F0003;query=Id%3A%22committees%2Fcommrep%2F3abfb90c-9215-4b65-a5d2-32d112e8cd46%2F0000%22.
[153] Hill, Barrie. 2023. “Submission to Comment on GenCost 23 Draft Document Review”, https://aemo.com.au/-/media/files/stakeholder_consultation/consultations/nem-consultations/2022/2023-inputs-assumptions-and-scenarios-consultation/submissions/barrie-hill.pdf?la=en.
[154] GenCost, p 78-79; 2023 IASR Assumptions Workbook.
[155] GenCost, p 78-79; 2023 IASR Assumptions Workbook.
[156] GenCost, p 78; 2023 IASR Assumptions Workbook.
[157] 2023 IASR Assumptions Workbook.
[158] GenCost. p 78. GenCost used data from the 2023 IASR.
[159] AEMO. 2024. “2023-24 Draft GenCost Webinar.” 32:20. https://aemo.com.au/consultations/current-and-closed-consultations/2024-forecasting-assumptions-update-consultation.
[160] Lewis, Alexander. 2023. “Liddell power station closure contributed to higher energy prices, regulator says”. 20 July, 2023. ABC News. https://www.abc.net.au/news/2023-07-20/nsw-energy-liddell-closure-report/102624382.
[161] Aurecon. 2023. 2023 Costs and Technical Parameter Review. p 9. https://aemo.com.au/-/media/files/stakeholder_consultation/consultations/nem-consultations/2023/2024-forecasting-assumptions-update-consultation-page/aurecon—2023-cost-and-technical-parameters-review.pdf?la=en.
[162] Aurecon. 2023. 2023 Costs and Technical Parameter Review. p 54. https://aemo.com.au/-/media/files/stakeholder_consultation/consultations/nem-consultations/2023/2024-forecasting-assumptions-update-consultation-page/aurecon—2023-cost-and-technical-parameters-review.pdf?la=en.
[163] Aurecon. 2023. 2023 Costs and Technical Parameter Review. p 54. https://aemo.com.au/-/media/files/stakeholder_consultation/consultations/nem-consultations/2023/2024-forecasting-assumptions-update-consultation-page/aurecon—2023-cost-and-technical-parameters-review.pdf?la=en.
[164] Aurecon. 2023. 2023 Costs and Technical Parameter Review. p 51. https://aemo.com.au/-/media/files/stakeholder_consultation/consultations/nem-consultations/2023/2024-forecasting-assumptions-update-consultation-page/aurecon—2023-cost-and-technical-parameters-review.pdf?la=en.
[165] Aurecon. 2023. 2023 Costs and Technical Parameter Review. p 52. https://aemo.com.au/-/media/files/stakeholder_consultation/consultations/nem-consultations/2023/2024-forecasting-assumptions-update-consultation-page/aurecon—2023-cost-and-technical-parameters-review.pdf?la=en.
[166] Aurecon. 2023. 2023 Costs and Technical Parameter Review. p 51. https://aemo.com.au/-/media/files/stakeholder_consultation/consultations/nem-consultations/2023/2024-forecasting-assumptions-update-consultation-page/aurecon—2023-cost-and-technical-parameters-review.pdf?la=en.
[167] Aurecon. 2023. 2023 Costs and Technical Parameter Review. p 51. https://aemo.com.au/-/media/files/stakeholder_consultation/consultations/nem-consultations/2023/2024-forecasting-assumptions-update-consultation-page/aurecon—2023-cost-and-technical-parameters-review.pdf?la=en.
[168] Beattie, Ben. “CSIRO: tipping the scales on cost?” The Spectator, January 9 2024. https://www.spectator.com.au/2024/01/csiro-tipping-the-scales-on-cost/.
[169] Beattie, Ben. “CSIRO: tipping the scales on cost?” The Spectator, January 9 2024. https://www.spectator.com.au/2024/01/csiro-tipping-the-scales-on-cost/.
[170] Transgrid. A1 HumeLink – Stage 2 (Delivery) – Draft Contingent Project Application. p 5. https://www.transgrid.com.au/media/vpnfetbi/a-1_humelink-draft-cpa-2_principal-application_8_december_2023-public.pdf.
[171] AEMO. 2023. ISP Methodology. p 80-81. https://aemo.com.au/-/media/files/stakeholder_consultation/consultations/nem-consultations/2023/isp-methodology-2023/isp-methodology_june-2023.pdf?la=en; AEMO. 2024. Appendix 6: Cost Benefit Analysis. p 34. https://aemo.com.au/-/media/files/stakeholder_consultation/consultations/nem-consultations/2023/draft-2024-isp-consultation/appendices/a6-cost-benefit-analysis.pdf?la=en.
[172] AEMO. 2024. Draft 2024 Integrated System Plan, Appendix 6: Cost Benefit Analysis. p 41-42. https://aemo.com.au/-/media/files/stakeholder_consultation/consultations/nem-consultations/2023/draft-2024-isp-consultation/appendices/a6-cost-benefit-analysis.pdf?la=en.
[173] Data for this analysis was sourced from Figure 7, Appendix 6: Cost Benefit Analysis of the Draft 2024 ISP. Due to the unavailability of the underlying data, we reverse-engineered the ISP chart to extract the numerical data. We then modelled the delivery of HumeLink in 2026/27 as advised by Transgrid and adjusted HumeLink’s capital cost accordingly, noting that AEMO estimated the capital cost based on the ISP model’s optimally timed delivery for HumeLink in 2029/30.
[174] Draft 2024 ISP results workbook – Step Change, Summary tab.
[175] Woodley, Ted. “Consumers have been sold a pup on Snowy 2.0’s exorbitant ‘plug’.” The Australian, December 20, 2023. https://www.theaustralian.com.au/commentary/consumers-have-been-sold-a-pup-on-snowy-20s-exorbitant-plug/news-story/3d7d2e5d4ca694b3d98f6ead87e09539.
[176] AEMO. 2024. Appendix 6: Cost Benefit Analysis. p 19. https://aemo.com.au/-/media/files/stakeholder_consultation/consultations/nem-consultations/2023/draft-2024-isp-consultation/appendices/a6-cost-benefit-analysis.pdf?la=en.
[177] AEMO. 2024. Transmission augmentation information. https://aemo.com.au/energy-systems/electricity/national-electricity-market-nem/nem-forecasting-and-planning/forecasting-and-planning-data/transmission-augmentation-information.
[178] AEMO. 2024. Appendix 6: Cost Benefit Analysis. p 42. https://aemo.com.au/-/media/files/stakeholder_consultation/consultations/nem-consultations/2023/draft-2024-isp-consultation/appendices/a6-cost-benefit-analysis.pdf?la=en.
[179] AEMO. 2023. Appendix 4: System Operability. p 43. https://aemo.com.au/-/media/files/stakeholder_consultation/consultations/nem-consultations/2023/draft-2024-isp-consultation/appendices/a4-system-operability.pdf?la=en.
[180] AEMO. 2024. Appendix 6: Cost Benefit Analysis. p 24. https://aemo.com.au/-/media/files/stakeholder_consultation/consultations/nem-consultations/2023/draft-2024-isp-consultation/appendices/a6-cost-benefit-analysis.pdf?la=en.