
We are not building enough apartments and we are building them in the wrong place. In Sydney, new construction is concentrated in outer suburbs – but that isn’t where people prefer to live. Instead, we need to build a lot more apartments in the inner and eastern suburbs, where the shortage of housing is most severe.
This paper suggests simple housing targets for local councils that partially rectify these problems. These targets respond to recent calls from the Productivity Commission and others to set housing targets on clear principles and on a firmer evidentiary basis. The proposed targets are higher than those recently set by the Greater Cities Commission, placing greater weight upon affordability.
Introduction
The need for higher housing targets
Metropolitan area targets
Excess demand for apartments
The apartment shortage
Population growth
Detached Houses
Total
The location of current construction
The GCC’s targets
Proposed local targets
Improved affordability
Population growth
Houses
Comparison to GCC targets
Implementation
Issues for Further Study
Data Appendix
References
Introduction
We are not building enough apartments and we are building them in the wrong place. These two problems can be rectified by setting and enforcing housing targets for local councils. These targets specify how much extra housing we need and broadly where it should be built.
As a case study, this paper discusses the Sydney housing market, the location of much of Australia’s most expensive housing. It argues that appropriately designed housing targets would involve a large increase in apartment construction in the affluent inner and eastern suburbs, where the housing shortage is most severe.
New South Wales’ (NSW) Greater Cities Commission (GCC) already sets housing targets for local councils in the Sydney metropolitan area. These targets are too low, they lack a clear rationale or evidentiary basis, and they lack a clear enforcement mechanism. This paper presents targets that partially rectify these problems.
Uncontroversially, targets should house a growing population. More importantly, targets should also aim to bring the price of housing down to the cost of supply.
The gap between the price of housing and the cost of supply represents excess demand for housing. It is inequitable and socially wasteful. A large body of Australian and overseas research (discussed below) finds that this gap arises because planning restrictions limit the supply of housing, pushing up its price. This effect is estimated to greatly exceed the possible benefit of these restrictions (Centre for Independent Studies, 2022). Indeed, the underlying logic or justification for these restrictions and the form they take is not clear. They seem to have evolved haphazardly as status quo bias and desire for social segregation in response to the growing demand for density. Targets are a way to undo the distortions caused by these planning restrictions.
Several government reports have called for the design and imposition of housing targets.
- The Commonwealth Productivity Commission (2022, p2) recommends that the National Housing and Homelessness Agreement should be substantially rewritten to include firm targets for new housing supply for state and Territory governments.
- The Falinski Inquiry into Housing Affordability and Supply (Parliament of Australia, 2022, para 3.83) recommends that incentive payments be made to states or localities that complete housing in excess of specified targets or benchmarks.
- The NSW Productivity Commission (2021, p276) says: “To avoid a cycle of ever-increasing housing undersupply and deteriorating affordability, we need housing targets that are:
-
- transparent and evidence-based
- sufficiently forward-looking to ensure timely service provision and allow for community engagement
- flexible enough to evolve with the economy and societal trends
- supported by strong governance that monitors progress and mitigates risks and uncertainties as they arise.”
This paper is a response to these appeals.
The paper outlines some of the simpler and more important considerations that should be factored into housing targets. That involves specifying the quantity and location of apartments. A more complicated analysis would also specify the quantity and location of detached houses but that is beyond the scope of this paper. The supply of detached houses is taken as given, recognising that it has strong inter-relationships with the market for higher density. Apart from considerations of simplicity and space, most new housing in Sydney is apartments. Moreover, most of the big policy questions hinge on the supply of apartments.
The proposed targets have three main objectives:
- Improve affordability;
- allocate housing to where it is most in demand; and
- base targets on evidence and clear principles.
Unfortunately, there are trade-offs between these objectives and the suggested targets represent a compromise. Future research will hopefully relax these trade-offs.
The need for higher housing targets
As noted above, a large body of research finds that planning regulations restrict housing supply and hence make housing expensive. Many summaries of this research are available, including Gyourko and Molloy (2015), Hamilton (2021) and Schuetz (2022a). Tulip (2020) discusses Australian research. This conclusion is echoed in official reports; recent Australian examples include the Commonwealth Productivity Commission (2022), NSW Productivity Commission (2021) and the Falinski inquiry (2022).
This expert consensus is not universally understood or accepted, especially among the general public. Tulip (2021) argues that most common objections are simple misunderstandings that are not taken seriously in the research literature.
Planning restrictions are often imposed at a local level and take a wide variety of forms including limits on use, height, lot size, floor area ratio and so on. This variety prompts the central question of this paper — if a central government wanted to ease these restrictions, how should it do so?
One increasingly popular and effective approach is a general over-ride. For example, in July 2009, NSW removed limits on the construction of granny flats. Construction over the next few years increased about five‑fold.[1] New Zealand’s ‘Medium Density Residential Standard’ requires large cities to permit up to three storeys and three dwellings on all existing residential parcels of land (Greenaway-McGrevy, 2022). California’s AB 2011 allowed medium-density residential development to proceed by right in commercial zones, permitting an estimated 2 million extra dwellings (Distefano and Calthorpe, 2022). Oregon’s OR HB 2001 legalised duplexes and triplexes. New legislation in Ontario permits the construction, as of right, of three dwellings per lot. Schuetz (2022b) lists dozens of similar reforms.
Minimum standards can prevent the worst restrictions. However, their uniformity is a limitation: different levels and forms of intensification are appropriate in different areas. Granny flats are not efficient in the inner suburbs, while high density is not efficient on the outskirts. In practice, blanket over-rides such as Auckland’s Unitary plan have tended to increase density most on the outskirts (Lynch and Lees, 2021); whereas the estimates below indicate that Sydney most needs development near the centre.
A more flexible approach is for the central government to set and enforce construction targets for local councils, allowing each council to decide how the target should be met. They could choose a small number of high-density developments or a larger number of medium density developments. Either choice improves housing affordability. The important thing is that councils need to allow more housing. The quantity should be decided centrally; the type can be decentralised. An approach like this is followed in many foreign jurisdictions, including England, California and some Canadian provinces.[2]
There are several reasons why the central government (whether state or federal) should over-ride local governments. First, local councils are biased against development. They represent nearby residents, not the direct beneficiaries — the newcomers moving into the area. In particular, local governments will act like a cartel, restricting supply and driving up the price of housing. That benefits the local residents but harms potential residents from outside the area and future generations.
Second, a substantial majority of respondents to opinion polls believe planning restrictions should be relaxed (Galloway and Malo, 2023) and society needs to build more housing (Committee for Sydney, 2023). However, when asked about housing ‘in your community’, this position is reversed (Commonwealth Productivity Commission, 2011, Table 2.3). This ‘Not in My Backyard’ (NIMBY) opposition is often seen as inconsistent, but it may reflect a co-ordination problem: ‘We will build if everyone else builds, but not otherwise.’ Targets with a clear rationale foster a recognition of shared effort and consistency of treatment.
Third, some planning restrictions reflect desire for social segregation by affluent residents. They have occupied the best real estate and do not wish to share it with renters, apartment dwellers or other newcomers (Einstein et al, 2019). This may have an ethnic dimension. Central governments, with broader constituencies, are more egalitarian and supportive of desegregation.
Fourth, current planning restrictions are arguably misguided. Many research papers and media stories suggest that voters misunderstand the effects of planning restrictions and suffer from status quo bias (Nall, Elmendorf and Oklobdzija, 2022; Demsas, 2022; Caplan 2022; Schuetz, 2022a, Ch 8).
The above rationales support central control of the quantity of housing, though not necessarily of its kind, and underpin the targets proposed below. Two rationales would support further central involvement but would involve additions or modifications to my targets. The first of these is that the central government has responsibility for reducing carbon dioxide emissions and hence increasing housing density. Second, high density is complementary with (so should accompany) transit infrastructure that is planned and financed by the central government. Modifying targets to reflect these considerations is for future work.
Instead of having two separate policies that essentially neutralise each other, it might seem simpler to abolish local planning restrictions. However, local control over development has substantial public support. Constraining local planning with targets permits local control over the type of housing that is built, while preventing the restriction of supply. Direct reform of planning processes so as to facilitate more housing might be preferable, however it is not clear how to achieve that.
Metropolitan area targets
This paper suggests short-run housing targets with three components. Estimates of these for each local government area are presented in Section 6.
Detailed estimates and source data are available at https://tinyurl.com/bdf6fwvn
To download the zip file, please copy and paste the url into a new browser window. For further questions regarding the data file, please contactptulip@cis.org.au.
These estimates sum to the estimates for Greater Sydney (excluding the Central Coast),[3] shown in Table 1. This section discusses how much should be built; later sections discuss where.
Table 1: Short-run annual housing target for Sydney
| Component | Annual number of dwellings |
| Higher density to improve affordability | 8,200 |
| Higher density to match the increase in population | 19,000 |
| Detached houses | 16,300 |
| Total | 43,500 |
| Memo: expected supply | 30,300 |
Notes: Estimates are rounded to nearest 100
Expected Supply is from NSW Department of Planning and Environment (2023)
As discussed below, these estimates are simple and conservative. In the longer-term, more complicated analysis will probably estimate higher targets.
For context, the table also shows the Department of Planning and Environment’s (DPE) central forecast of housing construction from 2021/22 to 2025/26. Other relevant comparisons are discussed below.
Roughly speaking, the second and third components (‘higher density to match the increase in population’ and ‘detached houses’) can be viewed as ‘business as usual’ at an aggregate level, though the spatial allocation differs. The novel and controversial component is ‘higher density to improve affordability’. The last two components are numerically larger; however, it is the response to affordability that keeps the market in balance, so it is arguably the most important.
Excess demand for apartments
A popular approach to estimating housing demand is to combine an estimate of population growth with an assumption about household size. Assumptions about household size often reflect a recent average, adjusted for expected compositional changes among demographic groups. This ‘demographic approach’ was popularised by the National Housing Supply Council in its State of Supply Reports and has recently been extended by the National Housing Finance Corporation (NHFIC, 2022).[4]
When cumulated over time and compared with estimates of housing construction, these implied demand estimates form an estimate of the housing shortage. For example, the 2016–17 NSW Intergenerational Report estimated a shortage of 100,000 dwellings. The Report estimated that 725,000 new dwellings were needed to cater for projected population growth between 2016 and 2036 (36,250 a year). In 2020, the NSW Productivity Commission estimated an accumulated shortage of 54,000 total dwellings in 2020, which was projected to increase to 100,000 by 2038 (p268).
The demographic approach provides a simple and useful benchmark, which is used below. However, as a guide to planning, it is incomplete. It assumes an arbitrary baseline is in balance. It does not take into account how desired household size declines with increases in income, lower interest rates and increased working from home. Effectively, the demographic approach models the demand for housing in changes as a function of population, with an elasticity of 1 and some complicated time trends; with the elasticities with respect to income, cost and other factors unrealistically assumed to be zero.
Furthermore, the demographic approach does not indicate where housing should be located nor the form it should take. Nor is it responsive to a change in preferences or household composition.[5]
A better way to gauge the demand for housing is by willingness to pay — that is, the prices buyers and renters pay for different kinds of housing at different locations. Prices and rents reflect what residents are willing to forgo and hence provide a measure of the benefit from housing. That can be compared with the cost of providing that housing to make welfare comparisons and guide policy. Moreover, measuring shortages via prices provides a guide to affordability, which is arguably what the public really cares about. ‘Making housing affordable’ and ‘reducing the shortage’ become synonymous.
A common misunderstanding is that prices are ‘distorted’ by extraneous factors, such as interest rates. However, interest rates are an important determinant of demand. When rates are lower, the demand for housing is higher. A well-functioning housing market would increase supply in response. Australia’s poorly-functioning housing markets have instead responded by increasing prices.
A similar argument is that prices are ‘distorted’ by tax concessions, such as negative gearing or the capital gains discount. However, these policies have been decided by democratic process to serve various purposes — and housing policy should arguably respect those decisions. More importantly, these concessions have only tiny effects on prices. Different studies using different approaches estimate their effect at about 1–4% (Daley and Wood, 2016, Box 6; Tunny, 2018; Cho, Li, and Uren, 2021; Deloitte Access Economics, 2019).
Jenner and Tulip (2020), following a widely-used approach pioneered by Glaeser, Gyourko and Saks (2005), provide estimates of the excess demand for apartments in Australia’s largest cities. Updating to 2021/22, the average Sydney apartment sold for $1,010,000 but cost only $594,000 to supply. That implies an excess demand of $416,000, or 41% of the price.[6] In a well-functioning market, that excess would be competed away by extra supply. In Australia’s cities, the excess is sustained by planning restrictions. Accordingly, it is referred to as the ‘zoning tax’ in academic literature.
Estimates using prices and costs for each local government area are shown in Chart 1. Judging by willingness to pay, people most want to live in the inner and eastern suburbs. Apartments in some of these areas tend to be large and high quality, however buyers are willing to pay far above the cost of supply. As Section 4 discusses, this is not where we have been building.
These estimates are discussed in detail in the Data Appendix. In brief, prices are the average of apartments sold in 2021/22. Costs comprise construction, margins, marketing, infrastructure, professional fees and finance expenses. It is assumed that the relevant planning restriction is a height limit so extra land is not required, however average construction costs increase with further height.
Chart 1: Apartment Overpricing
Sydney LGAs
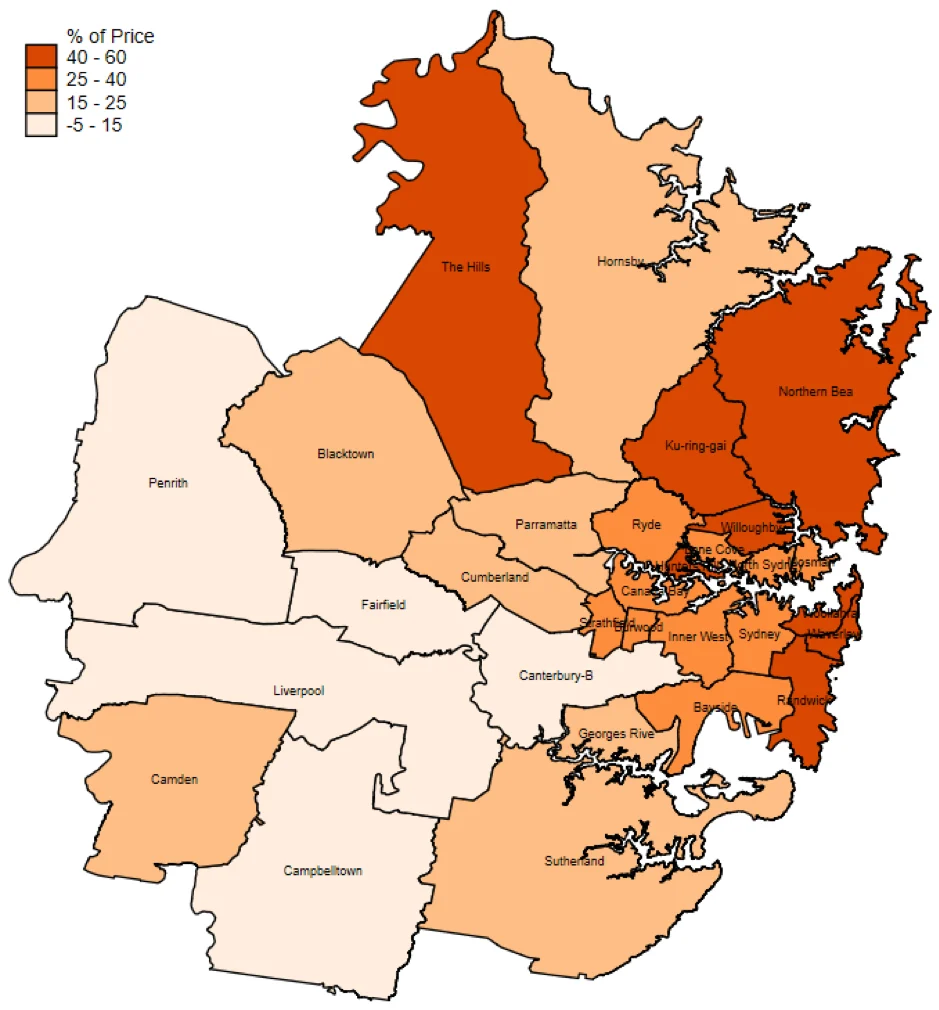
Notes: For presentational reasons the large, more sparsely populated LGAs of Central Coast, Hawkesbury, Blue Mountains and Wollondilly are not shown. Estimates for these and other areas are shown in Table 2, column 4.
The apartment shortage
The increase in quantity needed to reduce price to the current marginal cost of supply is given by multiplying the price wedge by the elasticity of demand for housing. Saunders and Tulip (2019) estimate this elasticity to be ‑0.4 at a national level — that is, for every 1% increase in the housing stock, the price of housing falls 2.5% — and note this estimate is near the middle of a range of Australian and international estimates. Moreover, it appears to be broadly in line with international changes in prices and quantities and with cross-section variations in household size.
To reduce price by 41%, assuming an elasticity of demand of -0.4, would require a 16% (= .41 x .4) increase in supply.
Under simplifying assumptions, that 16% increase in supply is the change needed to bring the apartment market back into balance. In that sense, it can be interpreted as an estimate of the shortage of apartments. Given the 672,000 apartments in Sydney in the 2021 Census, a 16% increase in supply would involve an extra 111,000 apartments. However, that calculation involves applying an average response to metropolitan area aggregates. When applied to the disaggregated data shown in Chart 1 and weighting by the number of apartments in each LGA (Table 2 below), the shortage totals about 82,000 apartments or 12% of the apartment stock, as discussed in Section 6. Assuming the shortage is eliminated over 10 years gives an annual requirement of about 8,200 apartments, shown in Table 1.
Some important assumptions underpin this estimate. One concerns what is happening in other segments of the housing market, such as that for detached houses or in other cities. Are extra apartments intended to simply solve the shortage of apartments in Sydney or the shortage of overall housing in Australia? It is simplest, and conservative, to assume the former. This might be motivated by an assumption that similar moves occur in other segments of the housing market.
Technically, that means an estimate of the elasticity of demand for total housing is appropriate, rather than the higher elasticity that would apply to a segment of the market. It also means the 12% increase in supply is applied to a narrow base — the stock of apartments in Sydney — rather than the whole housing stock. Alternative assumptions would imply a much larger target.
Another assumption is that the marginal cost curve is horizontal (though higher than average variable cost). A more complicated analysis would allow for marginal cost to increase with extra building. Jenner and Tulip estimate that a 10% increase in average Sydney building height (that is, from 10 to 11 storeys), would raise marginal construction costs by about 1.3%, or $4,600 per dwelling. That complication seems small relative to the noise in the data, so is ignored. Adjusting for it would slightly reduce the shortage estimate.
Subject to those qualifications, this estimate of the shortage of apartments, 82,000, is much greater than current estimates using the demographic approach by the NSW government, especially when considering that their estimates implicitly also include a shortage of detached houses. As noted above, major reasons for this are that this paper’s estimates allow for the demand for housing to have increased due to higher income, lower interest rates and increased working from home, whereas the demographic approach proxies these effects with time trends.
The 10-year horizon for eliminating the shortage is somewhat arbitrary. It reflects conversations with planning officials about realistic adjustment, consultation and planning delays.
Were these targets to be implemented, more precise measures could be estimated, as discussed in Section 8. However, excessive precision is not needed given that the targets are self-correcting. If a target is set too low and insufficient housing is supplied, the price will rise. The estimated shortage will increase and future targets will be revised up. In contrast, if the target is set too high, meeting it would not be financially viable. Typical remedies, such as a relaxation in restrictions (discussed in Section 7), would be harmless.
The UK government sets council housing targets by a slightly different formula, measuring affordability by the price/wage ratio.[7] In practice, this is highly correlated with the gap between prices and costs because local wages are a major element of costs. However, costs are the more relevant benchmark. Prices in excess of costs indicate that builders wish to increase supply but are being prevented by supply restrictions. In contrast, an unusual price/wage ratio may simply reflect an unusual stock of houses or demographic composition. Some councils (for example, those with large student populations) may have a large number of small low-cost dwellings. Their low price/wage ratios are not necessarily an indicator of adequate supply.
Population growth
The 2019 population projections by the ABS (2019) project that the number of households in Greater Sydney will increase at an annual average rate of 1.6% in the five years to June 2026 (the timeframe for many of our other calculations). Given the 1.9 million dwellings in Greater Sydney (excluding the Central Coast) in the 2021 Census, that implies an extra 30,800 dwellings a year would be needed to match household formation.
Between the 2016 and 2021 census, 38% of the dwelling growth in Sydney represented detached houses, with 62% being higher density.[8] I assume a similar split going forward; more precisely, that 62% of the 30,800 dwellings needed to match population growth each year are higher density. That implies 19,000 higher density dwellings a year, shown in Table 1.
Ordinarily, population projections would be straightforward and uncontroversial. However, more recent 2022 population projections by the NSW Department of Planning and Environment project that the number of households and implied dwelling demand in Greater Sydney will increase at a much slower rate: an annual average rate of 1% from 2021 to 2026, which would imply that only 19,000 dwellings a year would be needed to match household formation. However, these recent projections appear to be a biased basis for planning. They allow for a large temporary reduction in net overseas migration as a result of the pandemic. However, they do not allow for the large increase in working from home and desire for smaller households, also arising from the pandemic. Mondragon and Wieland (2022) and Gamber, Graham and Yadav (2022) find that this latter effect is large, so overall the pandemic boosted demand for housing, consistent with low vacancy rates and rising rents.
These problems posed by the DPE 2022 projections highlight limitations from relying only on demographic data. While demographics are important, they need to be supplemented by broader indicators of excess demand, specifically prices and rents.
The 2019 projections are for relatively steady population growth, being unaffected by the pandemic, so provide a guide to developments once conditions normalise. Indeed, recent government decisions to increase the immigration rate are likely to see substantial upward revisions to the 2022 population projections. Furthermore, the 2019 projections have the advantage of permitting consistent comparisons with housing targets made by the GSC and councils in 2020. The GCC has not revised those targets, a position supported by the arguments above.
Detached Houses
It might be desirable to estimate the new detached houses needed to match population growth and the shortage of houses as separate components. With regard to the latter, Kendall and Tulip (2018) estimate an excess demand for detached houses of 42% of the price. This estimate is broken down by Local Government Area in their Figure 3 and their online appendix. Assuming an elasticity of demand of -0.4 would have required an increase in the quantity supplied of 17% to reduce prices by 42%. Given the 992,000 houses in Sydney in the 2021 Census, that would imply a shortage of about 169,000 houses.
However, estimates like that are difficult to translate into planning targets at a local level. Whereas extra apartments can — and should — be built in locations with excess demand by building higher, that is not possible with detached houses. A shortage of detached houses requires either a different form of housing at the same location or more houses elsewhere. In large cities, the main response to a shortage of houses is to build more apartments.
How targets should precisely deal with the excess demand for detached houses is beyond the scope of this paper. A simple approach is taken of assuming that current targets are addressing this issue and hence that the construction of detached houses continues at its current level and its current locations. Specifically, the number of houses in Greater Sydney increased by 81,625 between the 2016 and 2021 census, or about 16,300 a year. That estimate is in Table 1.
A preferable way of implementing this assumption might be to base estimates on known greenfields developments in the pipeline. However, comprehensive data on that basis are not readily available. The discussion in several Local Housing Strategies suggests results would be similar.
Not explicitly addressing a shortage of detached houses is pragmatic, as dealing with the excess demand for apartments in Sydney would already put a substantial strain on the construction industry. For setting targets in other cities, this would be a more important issue.
Total construction
The implied total construction of 43,500 dwellings a year is marginally above the average 42,500 dwellings added to the Sydney region each year between the 2016 and 2021 census. So it is feasible and politically realistic, in the sense that the industry has built — and the community has accepted — similar levels recently.
However, by most other metrics, this would be a strong level of construction. It is much higher than current projections. As discussed in Section 5, the GCC’s local government targets require only 37,650 approvals a year. The NSW Government’s most likely scenario for the 5 years from 2021 is for 30,300 dwellings a year while their ‘high growth scenario’ averages only 32,256 dwellings a year. These projected levels of construction are barely enough to keep pace with population. They are insufficient to make significant inroads into the housing shortage and to reduce housing costs.
The National Housing Accord has a target of 1 million new homes over 5 years. On a proportional basis (18% of dwellings are in Sydney) that would mean 35,500 dwellings a year in Sydney. This paper suggests an approach the Accord could use for specifying targets at a State and Local level. It also suggests those targets should be more ambitious.
The proposed targets are substantially larger than the 26,100 dwellings added per year between the 2011 and 2016 Censuses. They appear to be higher than recent DPE estimates of net completions, though these systematically under-report relative to the Census; partly because DPE completions do not include secondary dwellings like granny flats that do not have a separate water connection and partly because they omit student and seniors accommodation that is classified as commercial.
The proposed targets are arguably not high enough. They do not include the dwellings needed to match falling average household size due to rising incomes. And they assume that the accumulated shortage of detached houses is being addressed by recent construction. Partially offsetting these factors, the effect of the pandemic on desired household size may be double-counted. This boosts both projection of population (specifically, the preference for 2019 projections over 2022) and shortage estimates. However, that effect is a one-off that will quickly become unimportant as the pandemic recedes into history.
While these issues need further consideration, an opposing argument is that targets should initially be conservative. Large parts of the construction industry appear to be operating near capacity (Ellis 2022; Devitt, 2022). Hence a short-run target similar to recent levels (but well above recent projections) might serve as a temporary pragmatic target; recognising that it is a stepping stone to higher levels of construction. Capacity constraints mean that increasing targets to address a conservative bias in our estimates is not urgent and may not even be feasible in the short-term.
The more important constraint is public opinion. The public does not seem to understand the role of extra supply in making housing affordable (Nall, Elmendorf, and Oklobdzija, 2022), nor the harm that planning restrictions do. Explicitly tying housing targets to measures of affordability can play a useful public education role. However, until there is greater public understanding, it is unrealistic to expect large increases in construction. When the rationale for targets is understood, it will be easier to increase them.
How disruptive would these targets be? The proposal is to build 28,000 new apartments a year. Given there are 658 suburbs in Sydney, that is 41 new apartments for each suburb. Given that the average apartment building has 117 apartments (Jenner and Tulip, 2020, Table 4), that is one apartment building per suburb every 2.8 years.
The location of recent construction
New detached houses are commonly built where land is inexpensive, such as on the suburban outskirts. As noted above, this paper takes those decisions as given.
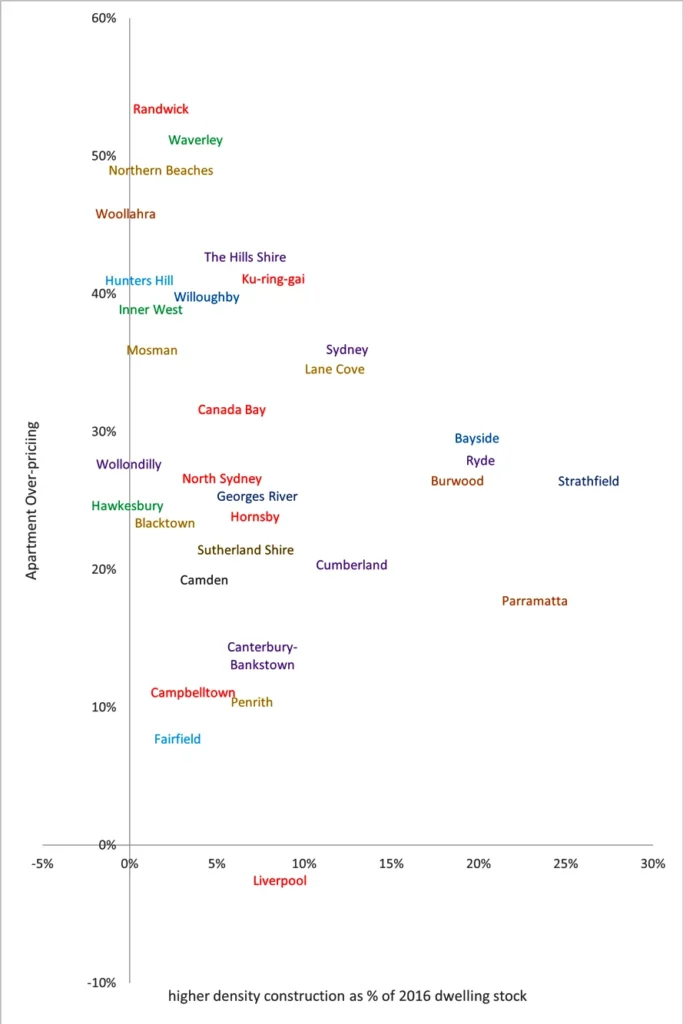
Of Sydney’s new housing, 62% is higher density — mainly high-rise apartments. Higher density uses relatively little land, so is more efficiently located where land is expensive, closer to the city centre and other amenities. As shown in Chart 1, that is where people want to live. However, that is not where Sydney has been putting its higher density housing.
Chart 2 shows recent construction by local government areas (LGAs) within the Greater Sydney metropolitan area. The vertical axis shows the price of apartments relative to the cost of supply, as mapped in Chart 1. The horizontal axis shows the increase in the number of higher density dwellings between 2016 and 2021 census as a percentage of the 2016 dwelling stock.[9]
The chart shows a substantial misallocation of housing. There is substantial excess demand for housing in eastern and inner locations shown at the top of the chart, such as Randwick, Northern Beaches, Waverly or Hunters Hill. However, very little housing is provided in these areas. Instead, construction has been strongest in areas where the net benefit of extra housing is much less, such as Parramatta or Strathfield.
The observations in the top-left of the chart, clustered near the city centre and the coast, are among the most affluent locations in the metropolitan area. As one moves down the chart and to the right, observations are increasingly drawn from the west and south, with income levels falling steadily.
Chart 2: We don’t build apartments where they are wanted
Zooming in on the left section of the chart highlights the essence of the housing problem. Chart 3 shows the councils most resistant to extra housing. To allay concerns that these councils might be approving low density instead, the horizontal axis is redefined as the growth in the total housing stock, including detached houses. The striking result is that several of these councils have allowed hardly any new housing — even though potential residents are willing to pay far in excess of the cost of supply. These are the areas where the net benefit of housing is very high. But those gains are being forgone.
Chart 3: The Biggest NIMBYs
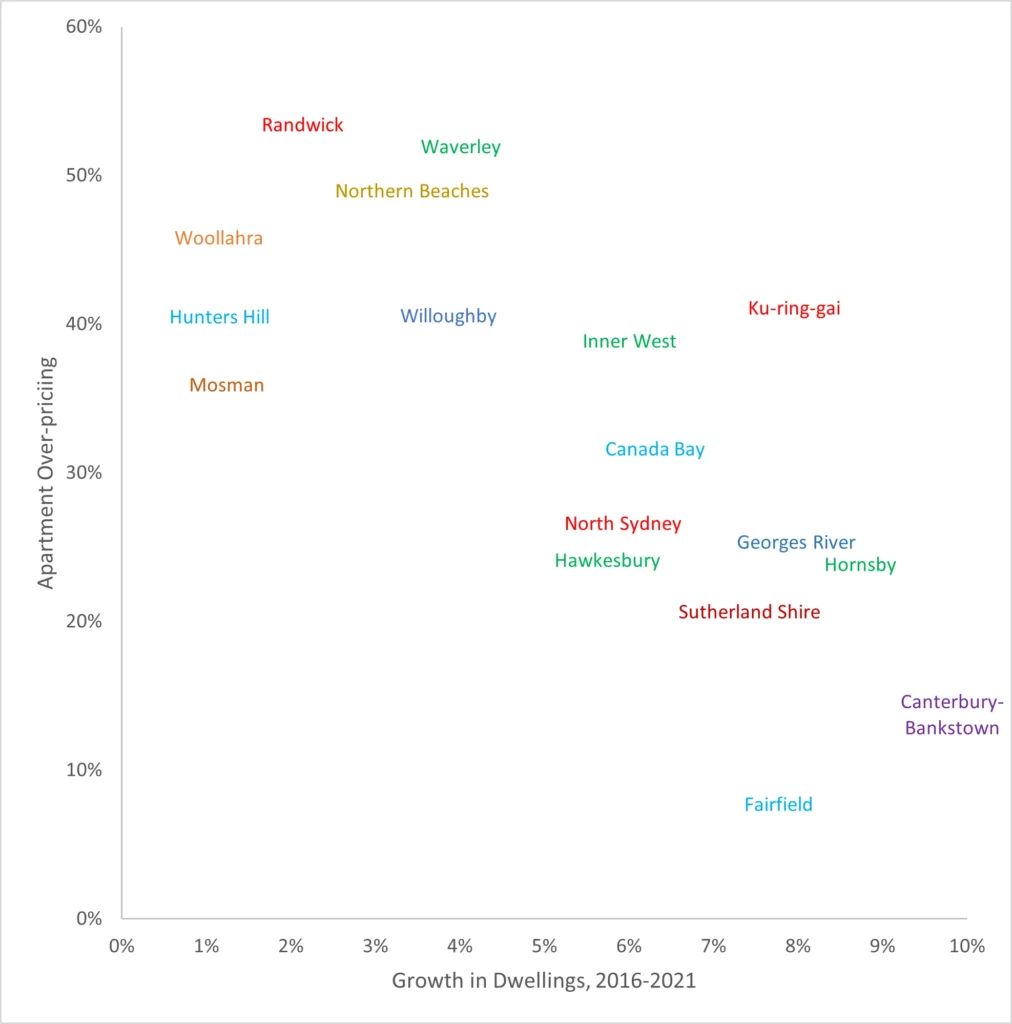
The charts show a strong negative relationship between prices and construction. A simple and plausible interpretation is that this traces out a demand curve, with high prices reflecting a restriction of supply.
The downward sloping relationship can also be interpreted as reflecting a location premium. This interpretation is complementary with the view that zoning restrictions are important, not (as Phibbs and Gurran, 2021 and Murray, 2020 mistakenly suggest) an alternative. High prices reflect the interaction of high demand with inelastic supply — either of these, without the other, would not matter. The demand for coastal and central locations is greater than that on the Western fringe. However, in the absence of zoning restrictions, extra supply would be forthcoming in areas where prices are high. Attractive areas would have higher density rather than exorbitant prices.[10] To be precise, housing would be slightly more expensive in high-rise locations, as construction costs increase slightly with building height. However, as Jenner and Tulip (2020) document, this variation is small relative to the variation in charts 1, 2 and 3.
It might be imagined that, as Sydney has grown, the demand for well-located property has grown even faster. Uniform supply restrictions would then lead to unusually high prices in attractive locations. However, this story does not describe the observations in Chart 3. The restrictions in expensive areas have been far tighter than those elsewhere.
This relationship can also be seen in other countries. Glaeser and Gyourko (2018) observe that the US cities with the strongest housing demand, such as San Francisco or Manhattan, also have the tightest planning restrictions. Many media stories (for example, Klein, 2023) argue that the most affluent areas have the tightest restrictions. This is consistent with the view that planning restrictions reflect a desire for social exclusion.
Building apartments in the outer suburbs is often justified by lower costs. However, differences in construction costs are allowed for in the estimates, with other costs (marketing, finance, etc) adjusting proportionately.
If data were available on differences in other costs between regions, it would be desirable and simple to enter it in the calculations. Perhaps most important in this respect is differences in infrastructure costs, which can be sensitive to topography, density and the legacy of previous development. However, as discussed in the data appendix, available data do not suggest that variations in infrastructure costs are important. Moreover, many infrastructure cost differences would amplify the estimated differences, as per-dwelling costs for many utilities decline with density. Moreover, transport infrastructure would be economised by building more housing in inner suburbs and near train stations.
The estimates do not allow for differences in land costs, assuming that extra apartments can be supplied by ‘building up’, which is the least costly method of increasing supply. A more complicated analysis could allow for differences in the cost of ‘building out’. This would reduce the severity of the shortage in inner suburbs where land is expensive. It would flatten the slope of the relationship in Charts 2 and 3 but not greatly change its shape.[11]
The GCC’s targets
The Greater Sydney Commission, as it was then called, specified 5-year and 20-year housing targets at a broad regional level in its Greater Sydney Region Plan, A Metropolis of Three Cities (2018 p62). District plans specified targets for each local council for 2016 to 2021 which essentially reflected the existing construction pipeline. Needless to say, using the existing pipeline as a target perpetuates the status quo and achieves few of the objectives for which targets have been proposed.
By early 2020, the GSC sent a letter to each council specifying 2021/22 to 2025/26 target ranges for each.[12] These sum to between 37,650 and 43,520 dwellings a year. These are the targets that govern current building decisions. However, they have many inter-related problems.
First, specifying a range is an obfuscation. Failure to attain the lower bound invites enforcement action, discussed in Section 7. However, it is not clear that exceeding an upper bound should have any consequences or why anyone should pay attention to it.
Second, there is little explicit logic or evidence underlying the GSC targets. The GSC’s (p62) explanation as to how these targets were decided is vague and uninformative:
The development of housing supply targets … has been informed by an assessment of data and information sets, in particular, the NSW Department of Planning and Environment dwelling projections; the NSW Department of Planning and Environment housing supply forecasts; the NSW Intergenerational Report; Housing Market Demand Areas; housing market preferences; and existing local infrastructure capacity.
In practice, GCC targets are very similar to recent construction rates.
Third, the targets are too low, especially the lower range, which — as noted above — is the target that matters. The GSC’s minimum, 37,650 is substantially below the target 43,500 completions suggested in Table 1. That comparison understates how low the GCC’s target is, given that section 3.4(6) of the GCC Act implies their targets are for approvals, not completions. Given that the GSC/GCC do not explain their estimates, it is difficult to decompose the difference. However it can largely be accounted for by the incorporation of 8,200 dwellings a year within the proposed target to improve affordability. In contrast, GSC and GCC publications do not say that affordability is a factor in their target calculations.
Fourth, the government and broader planning system express very little interest in the GSC targets. They are not published together. The targets presented below had to be entered by hand from 33 separate documents (a letter to each council). I am not aware that the sum of these — that is, targets for the Sydney region as a whole — has appeared in a government document. Nor does the government appear to monitor or report progress toward meeting them. Section 21(a) of the GCC Act requires the GCC to report on ‘the outcomes achieved by the Commission’ in its Annual Report, but the Commission has apparently decided that this does not include achievement of targets.
Proposed local targets
This section proposes housing targets for each local council in Greater Sydney. The calculations are intended to be transparent and simple, so that they can be extended and/or modified. The focus is on targets for the period 2021/22 to 2025/26, using pre-pandemic population projections, for comparability to GSC targets.
Improved affordability
We should build more housing where people want to live, as judged by their willingness to pay for a location. Sale prices are an important indicator, however housing prices also reflect construction quality, floorspace, and so on. We can control for these with estimates of cost. The difference between price and cost provides a measure of demand that is not driven by differences in quality and size. This difference is often called over-pricing, the location premium or the ‘zoning tax’. Chart 1 shows this measure for apartments for each local government area. Table 2 provides further details.
Incorporating estimates of over-pricing into construction targets provides a way to allocate supply to where the demand is greatest. At the same time, it unwinds the most severe planning restrictions. In microeconomic terms, supplying dwellings where there is the biggest gap between price and marginal cost provides the greatest value at the least cost.
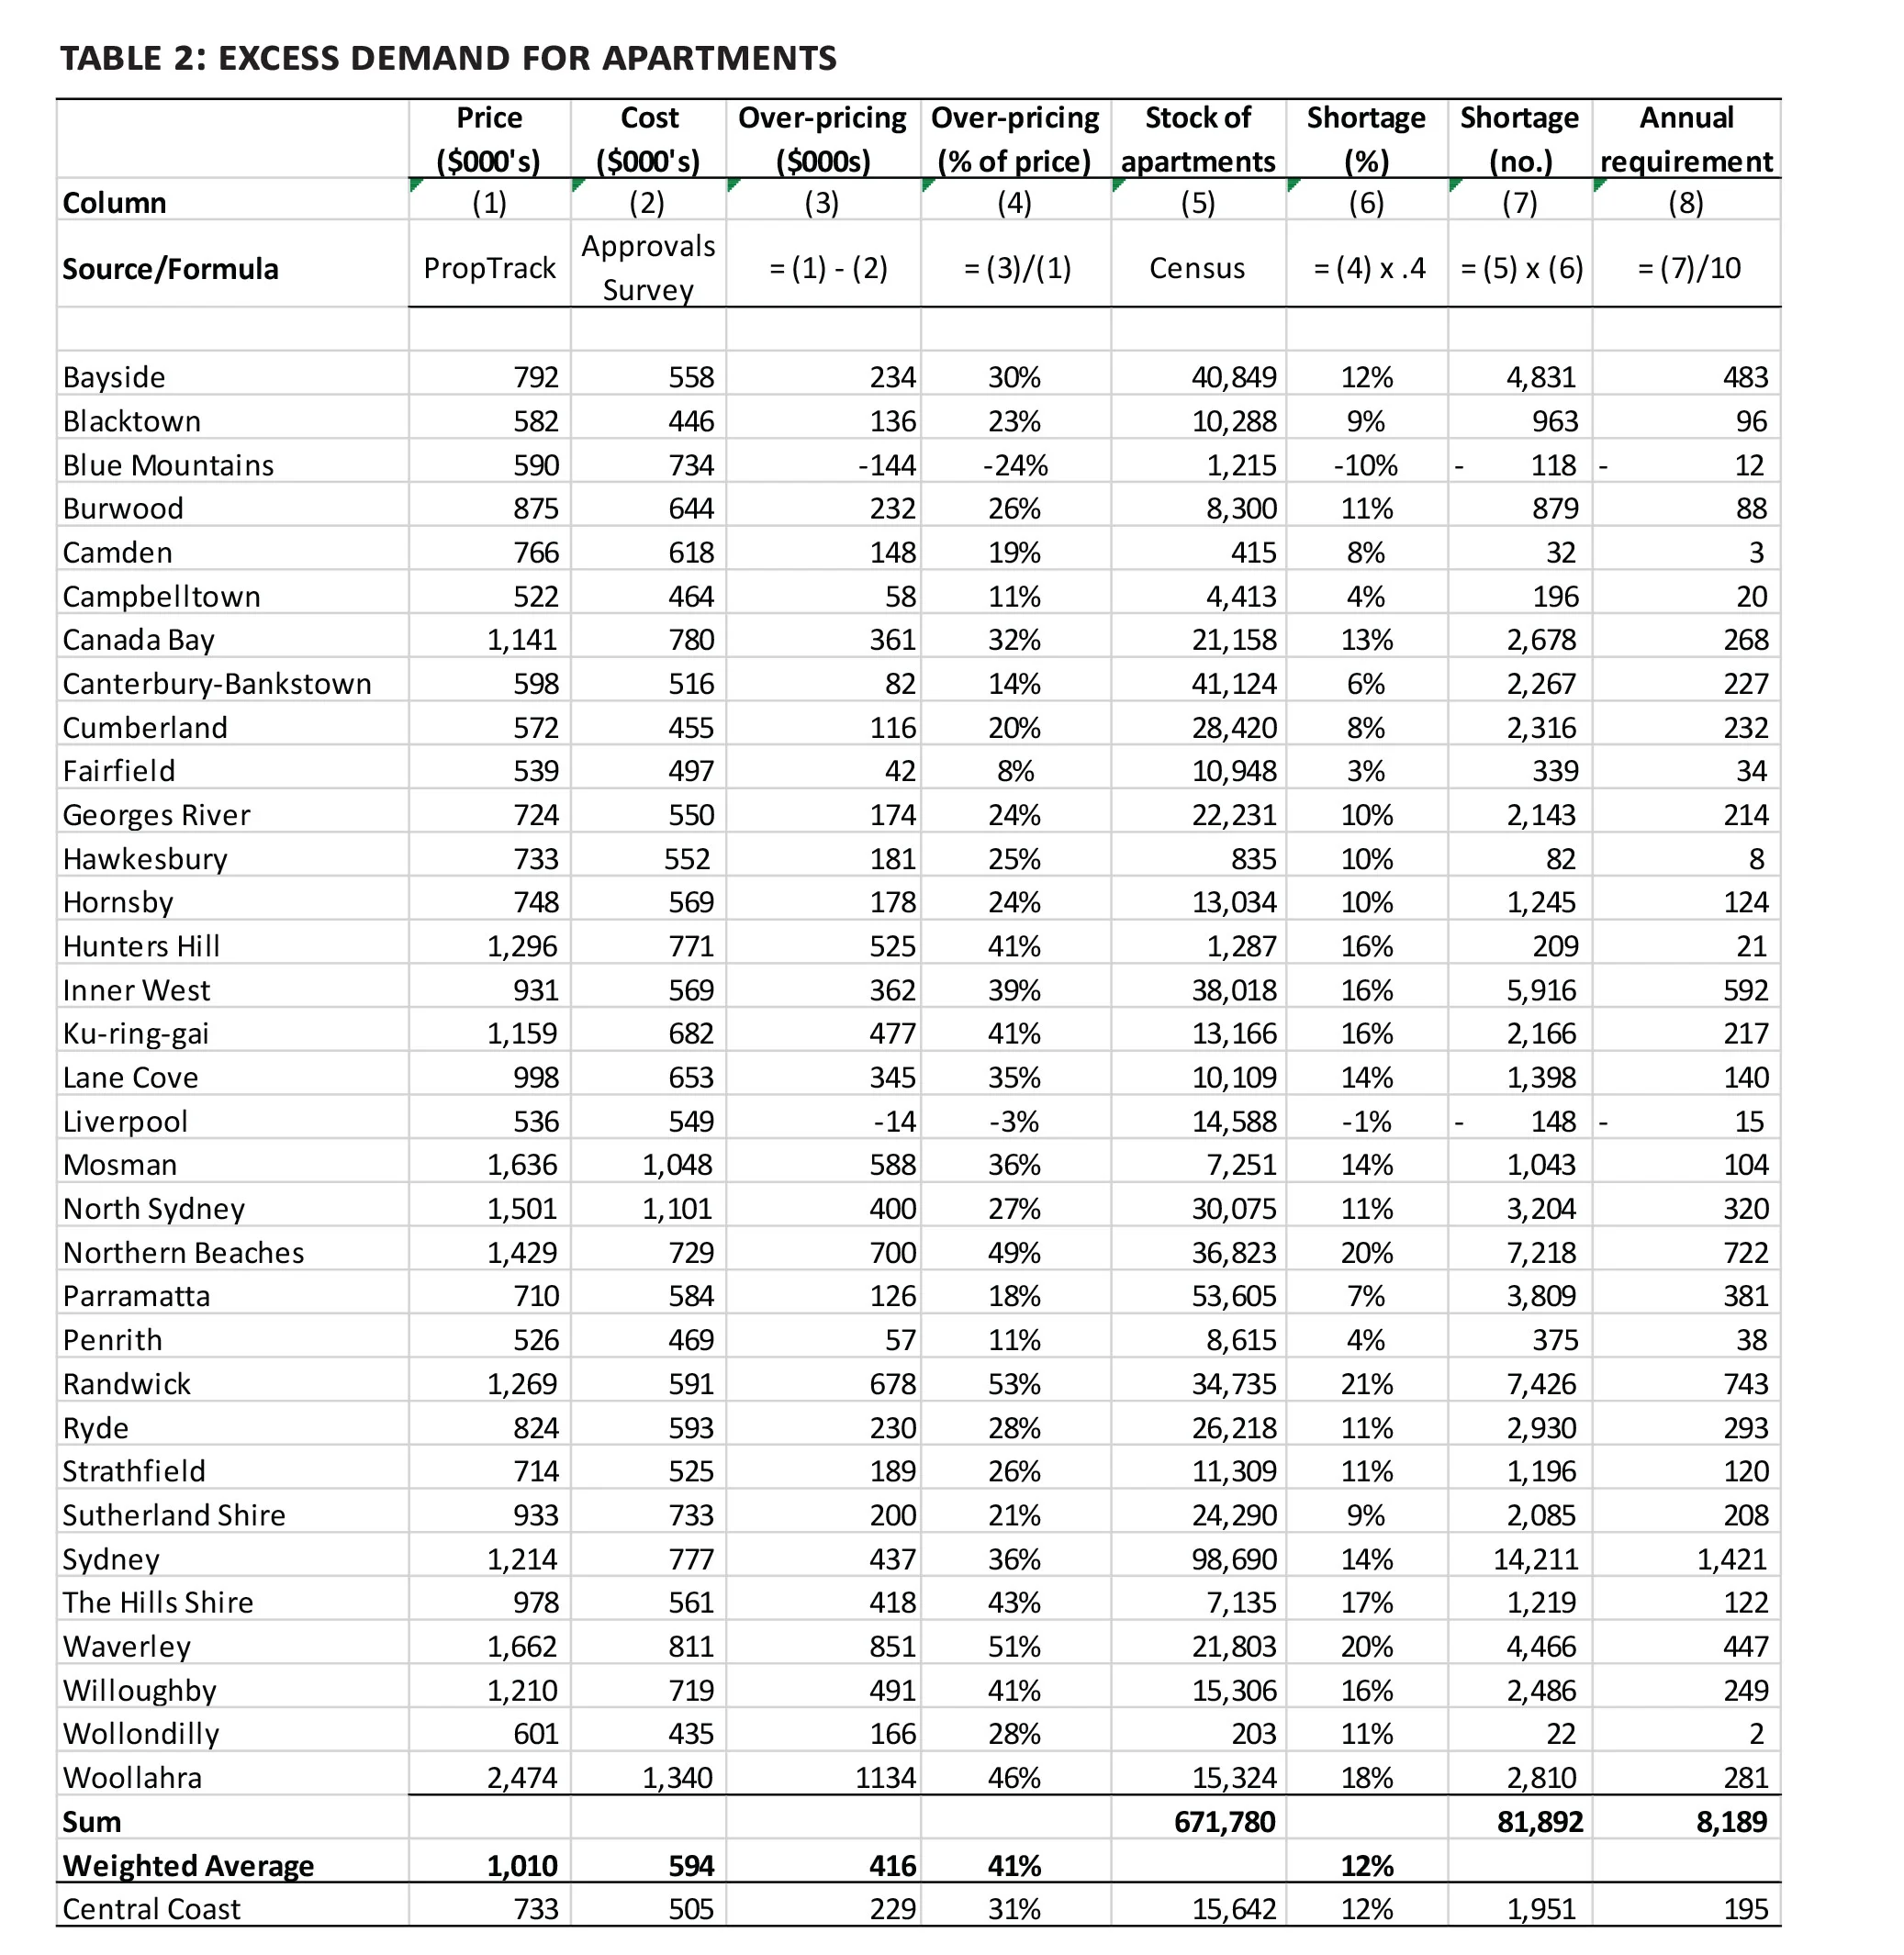
Notes: Prices and costs are rounded to nearest $000. Aggregates use different weights (e.g. prices by sales, costs by buildings) so differences between aggregates differ from the sum of disaggregated differences.
As an illustration, Randwick is one of the local government areas with the most severe over-pricing; with the average apartment selling for $1,269,000 in 2021/22. These high prices are not because those apartments are large or fancy — the cost of supply is only $591,000, approximately the Sydney average. The wedge between price and marginal cost is $678,000 or 53% of the price.
To reduce prices by 53% requires a 21% increase in supply, assuming an elasticity of demand of -0.4. As of the 2021 Census, there were 34,700 apartments in Randwick; so 7,400 (=34,700 x .21) extra apartments are needed. Assuming the shortage is eliminated over 10 years, that is 740 apartments a year, shown in the final column.
In contrast, and as shown in Chart 3, only 1,258 total dwellings (2% of the stock), or 252 a year, were supplied in Randwick between the 2016 and 2021 Census. This was one of the lowest construction rates in the metropolitan region. It is a major reason prices are so high.
The largest LGA without a shortage of apartments is Liverpool. Apartments in the Liverpool local government area sell for $536,000, about what it costs ($549,000) to supply. That means there is little net value in supplying extra apartments there. Though, to maintain that balance, extra building is needed as population grows, as the next section discusses.
Population growth
As noted earlier, Sydney needs about 30,800 extra dwellings a year to match expected population growth. Where should they be located?
The NSW government provides ‘implied demand’ estimates for each local council areas. However, these are a function of expected construction, so the ‘forecasts’ are self-fulfilling — supply matches implied demand which matches supply.
Another possible answer is ‘Where the demand is greatest’. However, if excess demand is eliminated, as suggested in the previous subsection, then the demand for extra high density would be evenly balanced throughout the metropolitan area. If prices are close to marginal cost throughout the metropolitan area, then one location is about as good as another and a uniform allocation is appropriate.
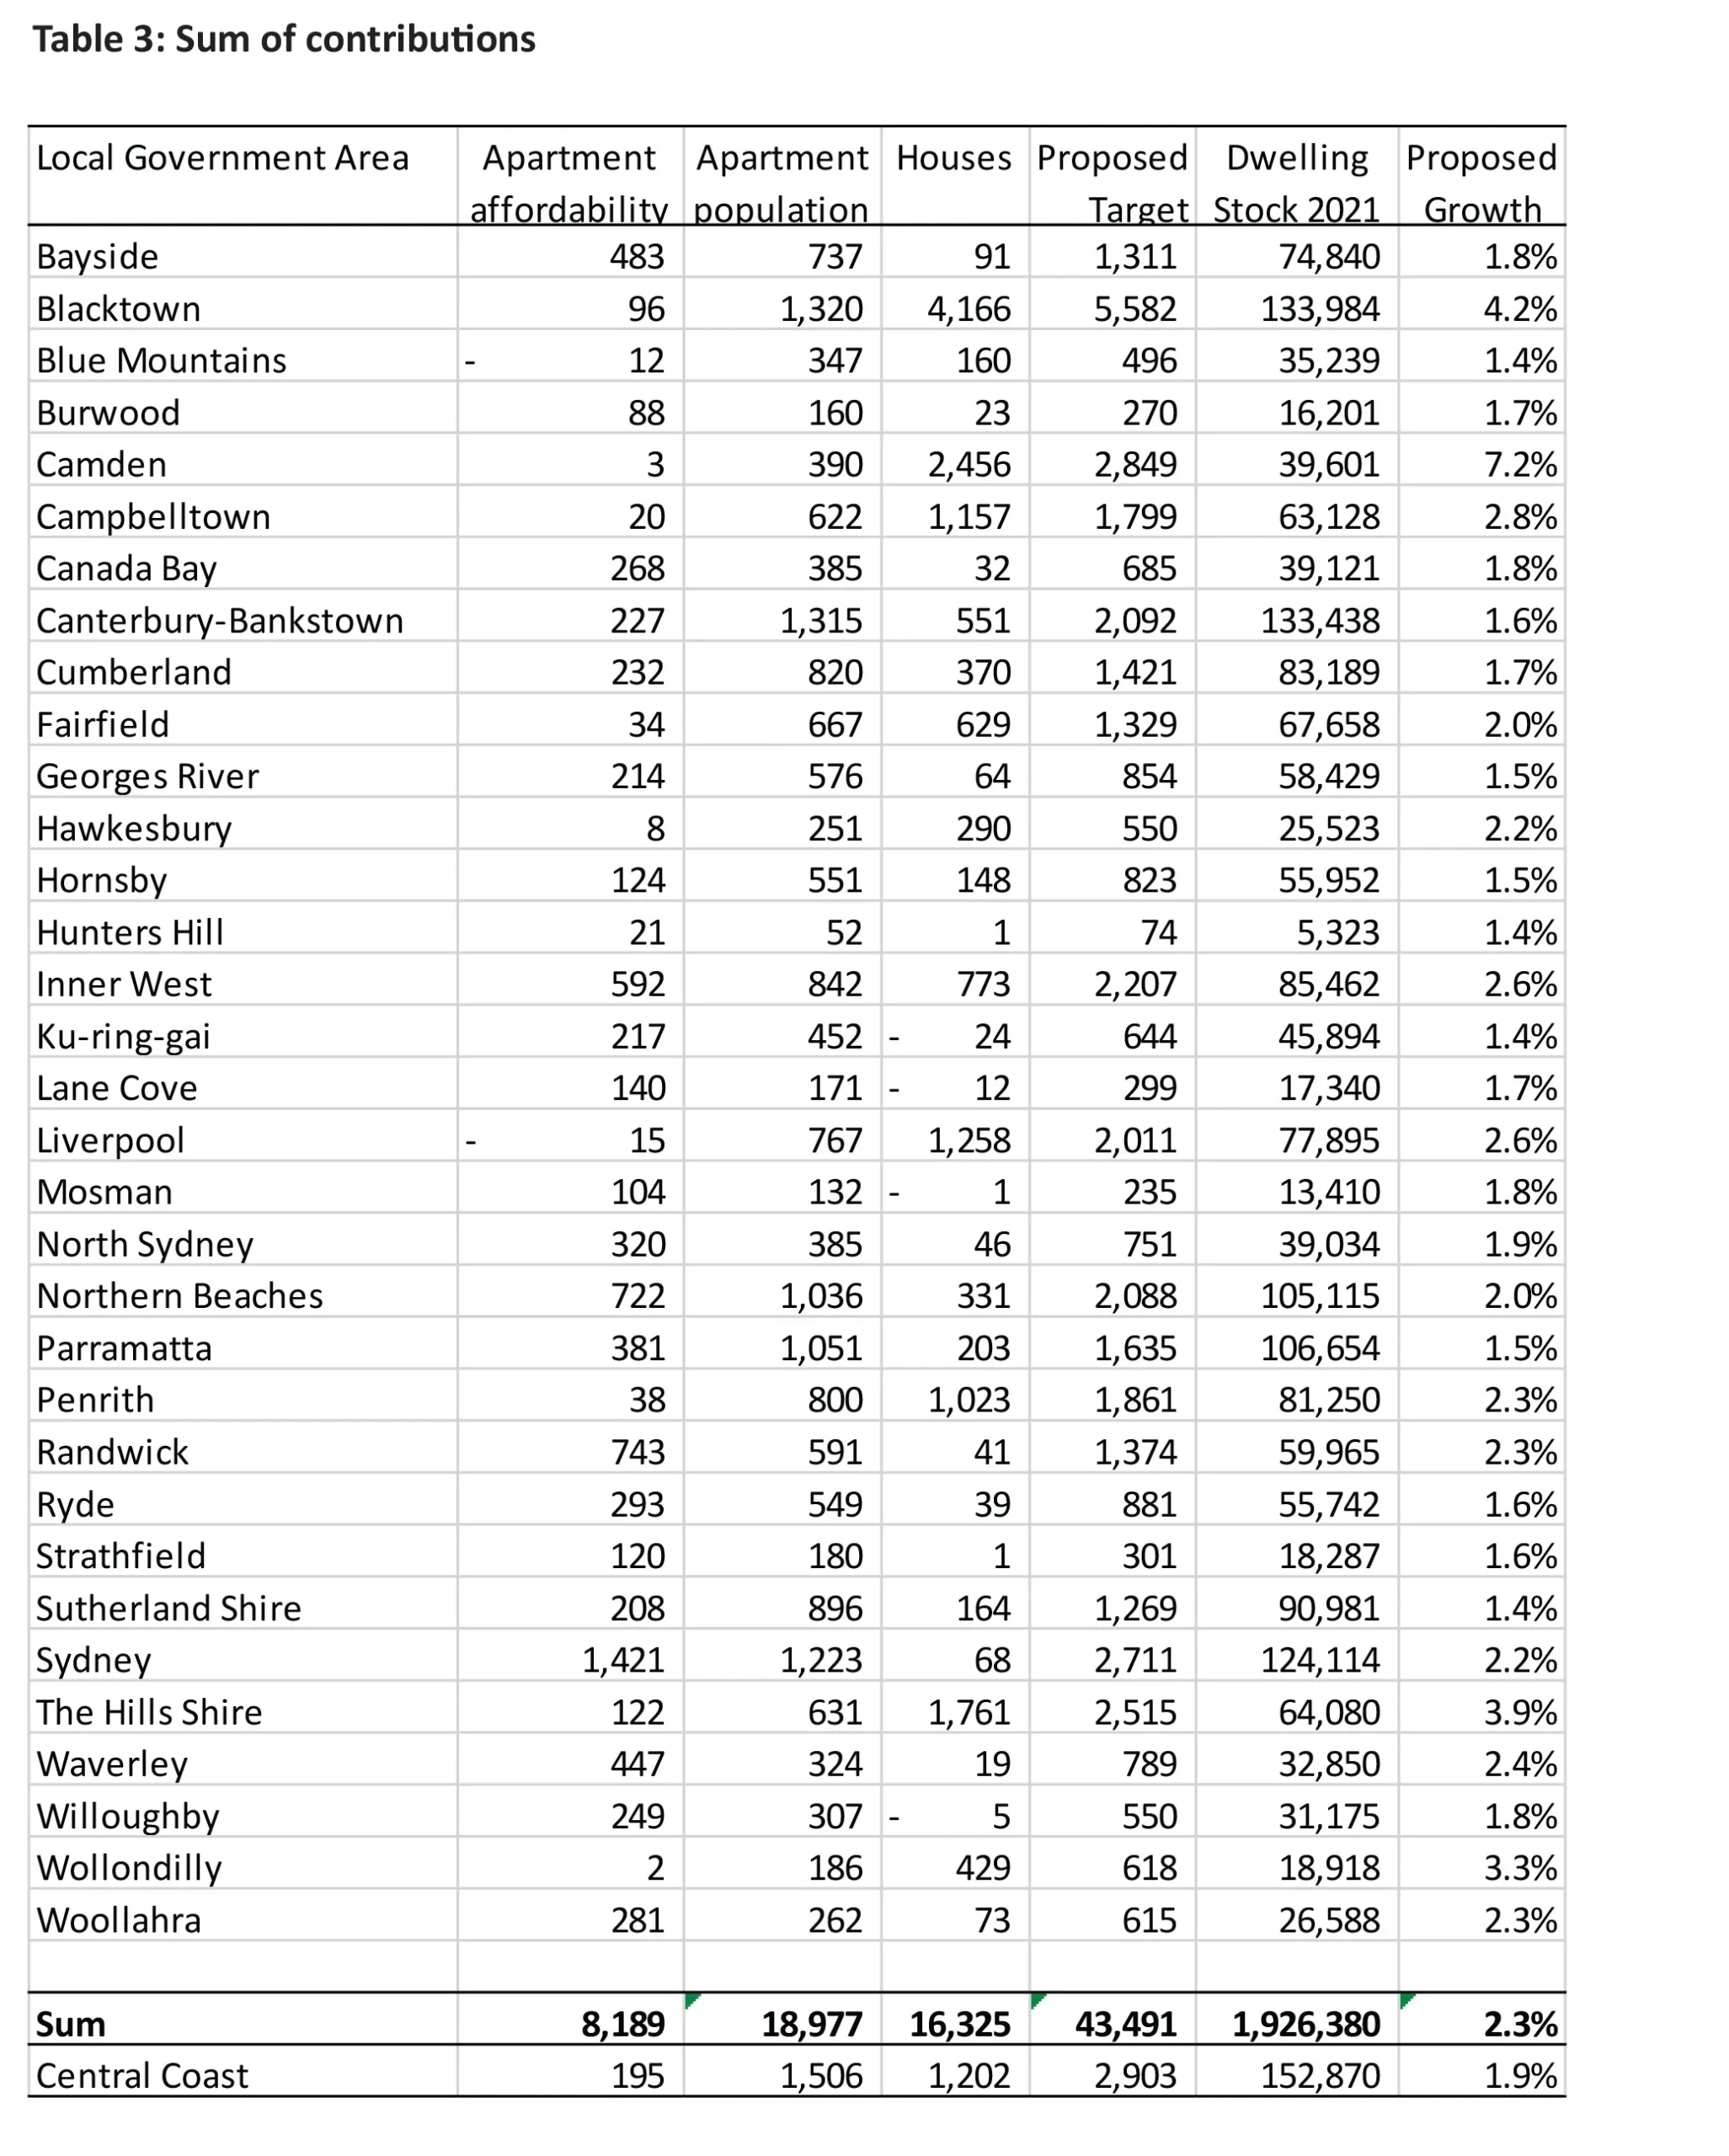
Accordingly the proposed targets allocate 62% of the 30,800 projected new households among local governments in proportion to their existing housing stock — 62% being the higher density share of new dwellings in Greater Sydney between 2016 and 2021. Essentially that means a baseline growth in the dwelling stock in each local government area of at least 1% a year (more precisely, 1.6% x .62 = 0.985%).
These estimates are shown in the ‘Apartment Population’ column in Table 3, together with other components.
Houses
The location of detached houses depends on issues of land release, infrastructure provision, and so on, that are important but separate to the main concerns of this paper. Detached houses are assumed to be supplied in the quantity and locations they have been in the recent past, specifically the change between the 2016 and 2021 Census.
These estimates are shown in the column titled ‘Houses’ in Table 3. One interesting feature is that three local government areas in the west — Blacktown, Camden and the Hills Shire — account for about half the total, with other outer-ring areas accounting for most of the rest.
Comparison to GCC targets
The three target components are shown in Table 3 above. Chart 4 compares these with GCC targets. Given the similarity between GCC targets and recent construction, a comparison with the latter would look similar. To improve readability, both targets are shown as a percentage of the current dwelling stock on log scales. The diagonal line represents where the proposed targets equal the GCC’s. More details are given in Table 4.
Chart 4: Housing Targets; Proposed vs. GCC
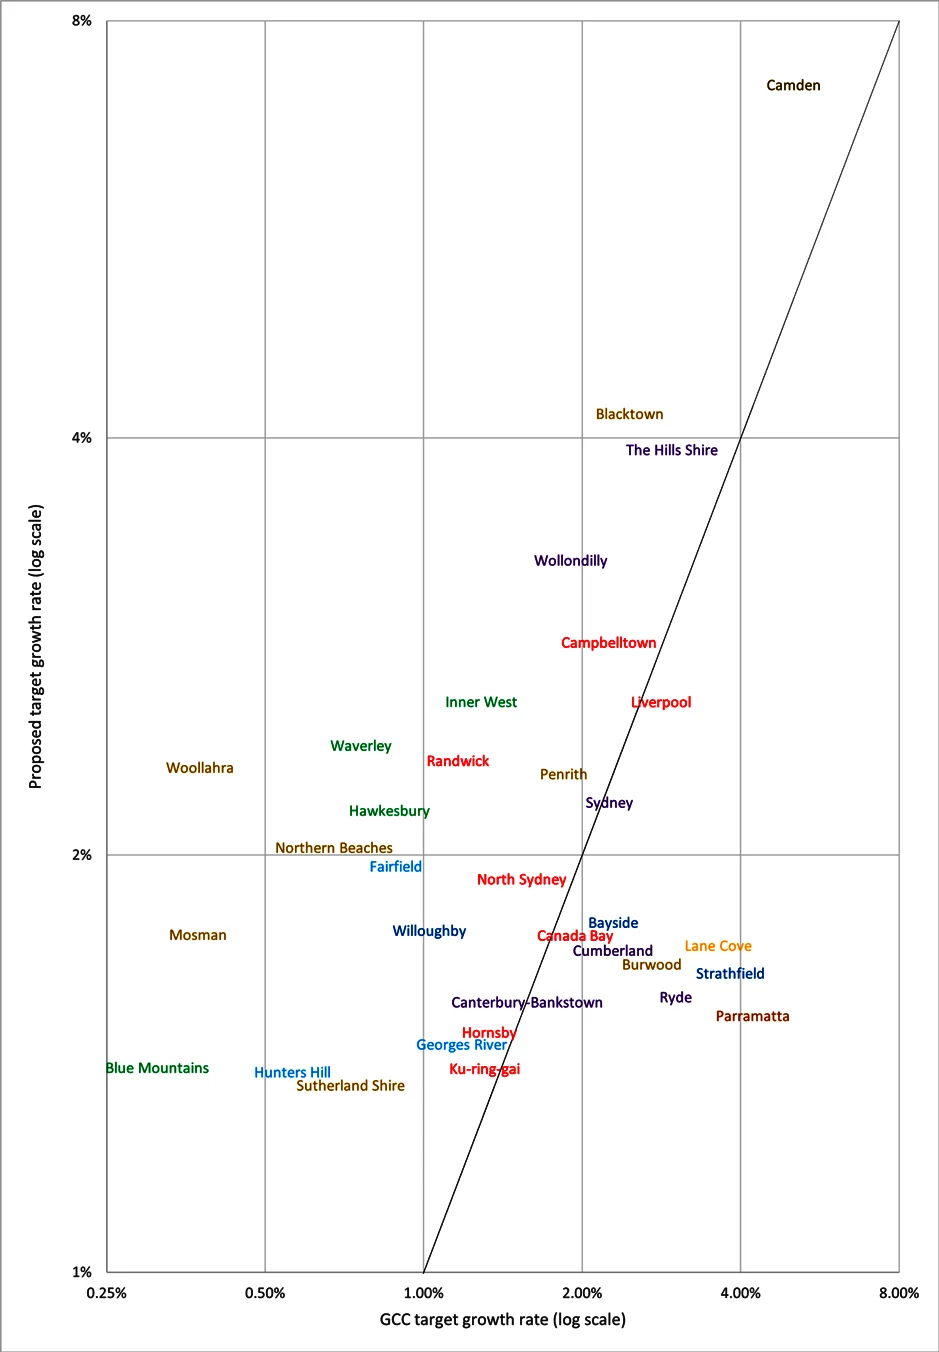
Annual Growth Rates, 2021-2016
Table 4: Annual totals, compared
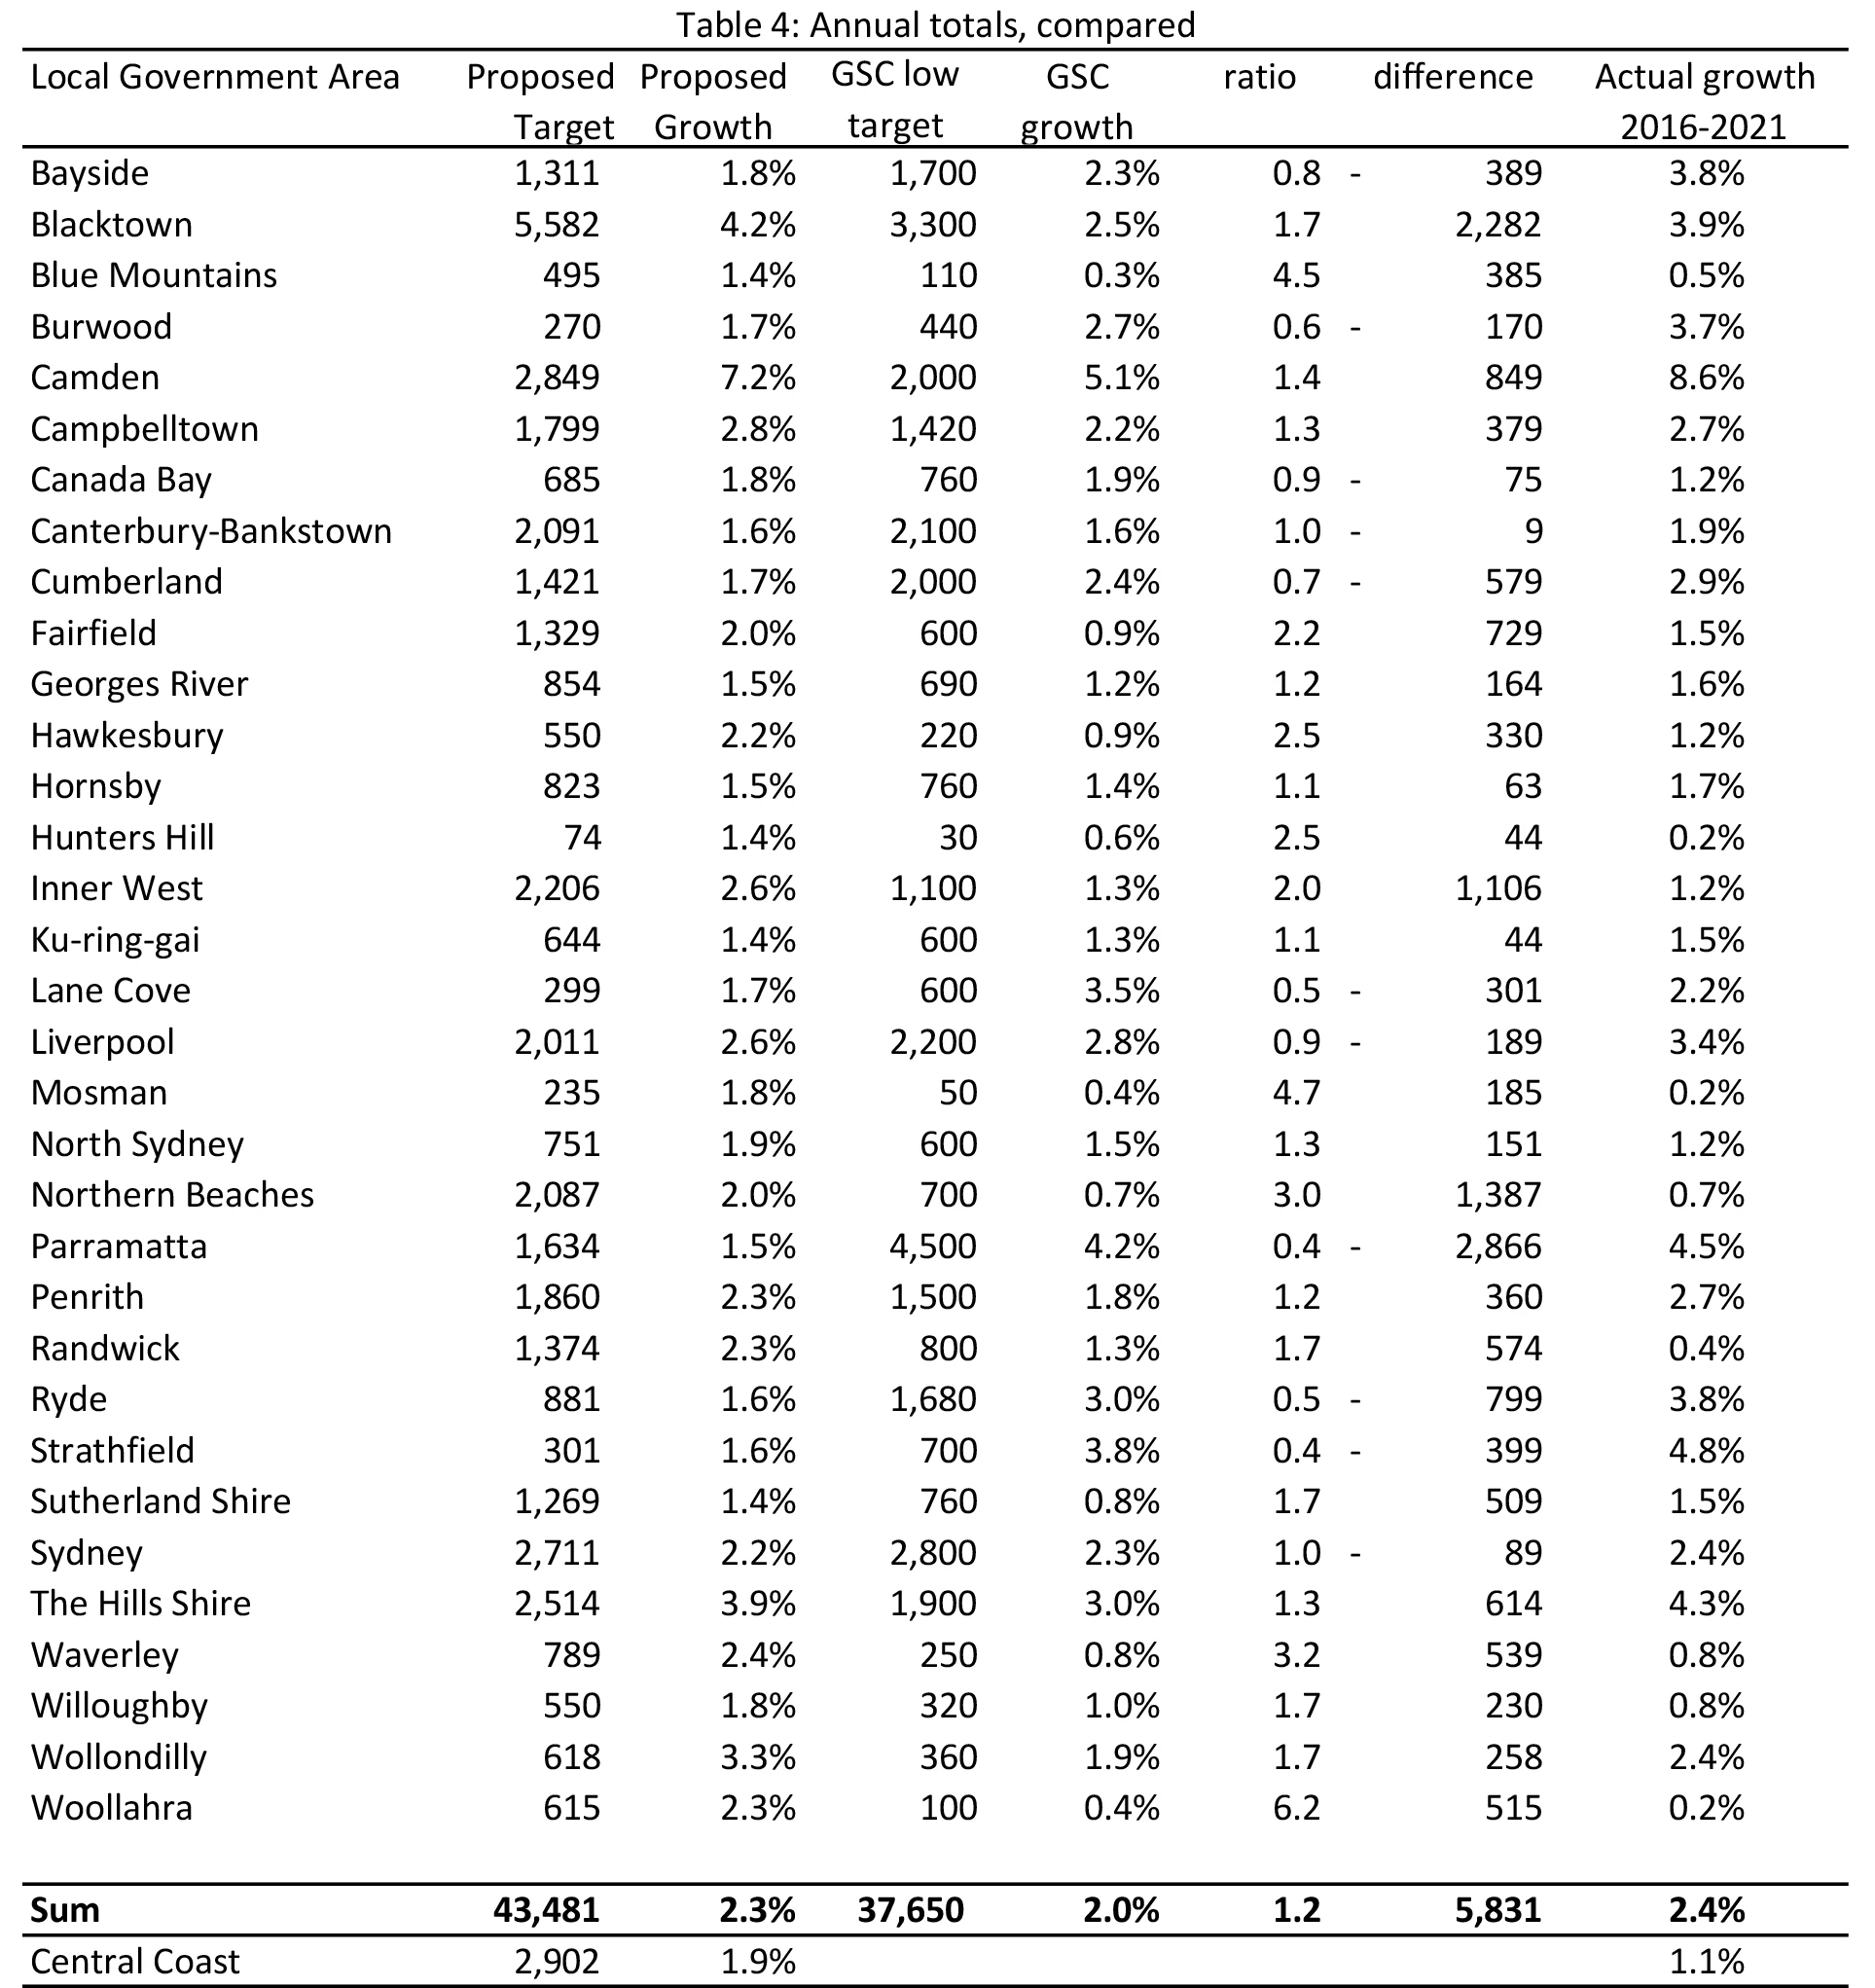
The proposed target for Woollahra, 615 dwellings a year, is six times the GCC’s target. That reflects the unusually low GCC target (100 dwellings a year, or 0.4% of the dwelling stock). Other large proportionate differences also reflect councils with very low GCC targets, including Mosman (50 dwellings a year or 0.4% of the dwelling stock), Blue Mountains (120 dwellings or 0.3%), Waverly (250 dwellings or 0.8%) and Northern Beaches (700 dwellings or 0.7%). There is no clear reason why building is prevented in these areas. On the contrary, the returns from building in most of these areas are unusually high, as shown in Chart 3. Accordingly, the moderate targets proposed for these areas are 3 to 4 times larger than the GCC targets.
The councils where the largest numerical increases in targets are warranted are Blacktown (an extra 2,282 dwellings a year needed), the Northern Beaches (an extra 2,865 dwellings a year needed), Inner West (1,107), Randwick (574), Waverly (539), Woollahra (515), and Sutherland (509). With one exception[13], these LGAs are located near the city centre and/or the coast. They have over-priced apartments and surprisingly low GCC targets.
There are several council areas where proposed targets are well below the GCC’s, including Parramatta (with a margin of 2,875), Ryde (799) and Cumberland (579). In the absence of an explanation for the GCC’s targets, explaining these differences is difficult. Designated development precincts and the conversion of old industrial land to residential may be factors.
Implementation
Targets are useless without enforcement. While the details of implementation are a separate subject and beyond the scope of this paper, a few general comments may be useful.
Given the long lags in housing development, progress towards attainment needs to be frequently monitored and enforced. From the Local Environmental Plan (LEP), though Development Approvals, Building Approvals, Commencements and Completions. To monitor and enforce only upstream stages would invite unrealistic goals and later evasion. To monitor only downstream stages would prevent timely remedial action. Of course, progress at each stage should allow for natural slippage.
When Ku-ring-gai Council threatened to ignore its target in 2020, the then Planning Minister, Rob Stokes said if the council did not want to undertake local planning responsibilities, “I can appoint a planning administrator to do it for them” (Thompson, 2020). This remedy is authorised by Section 9.6 of the Environmental Planning and Assessment Act.
This option involves more discretion and is more drastic than is required, escalating the issue and inviting a backlash. So it is costly to implement. Glenn Stevens’ (2017 p15) proposal for the GSC (now GCC) to assume the planning functions of the council has similar difficulties.
A more practical approach might be to automatically relax some zoning restrictions if a council fails to be assessed as making satisfactory progress towards its target. This has the added advantage of calling the bluff on councils who argue their restrictions are not binding. Moreover, should a target exceed what is financially feasible to build, the remedy is harmless. Within this general approach there are several models:
- In California, New Jersey and (recently proposed in) New York, failure to produce a compliant housing plan or hit targets results in the suspension of almost all zoning restrictions. When this ‘builder’s remedy’ was applied to the city of Santa Monica, two decades’ worth of construction was automatically approved within days (Breach, 2022, Owens, 2023)
- A milder remedy would be for automatic approval being given to medium density housing within walking distance of major transit stops. For example, New Zealand’s 2020 National Policy Statement on Urban Development allows six-storey buildings within 800 metres of rapid transit stations.
- When local councils in England failed to meet their targets, the Local Plan was deemed out of date and the Planning Inspectorate ruled on planning applications with a “presumption in favour of sustainable development”. In December 2022, targets were made advisory instead of mandatory, a policy reportedly opposed by a majority of members of the House of Commons (Allegretti, 2022). In NSW, a similar measure would involve directing local and district planning panels to make adherence to the target a top criterion in assessing applications.
These remedies are not exclusive. One could apply light remedies on an initial finding of unsatisfactory progress, increasing in severity over time.
We want carrots as well as sticks. Councils should be rewarded for completing housing in excess of targets. The incentive payments recommended in the Falinski Report (paragraph 3.83) would help. Many submissions to that inquiry (for example, section 6.2 of CIS, 2021) argued this was an appropriate role for the Federal Government. Targets could be part of the National Housing Accord.
Issues for Further Study
This paper is intended to be the beginning of target calculation, not the end. It has sketched some of the simplest factors that should be considered in constructing targets, but more needs to be done.
The biggest uncertainty in the setting of targets is clarifying where new detached houses should be built. Presumably, that involves integrating demand side factors — like measures of over-pricing — with the cost of land and infrastructure. Large estimates of the zoning effect on Sydney houses (Kendall and Tulip, 2008) suggest that construction has been too low and more density is needed, however precise implications for policy are not yet clear.
The other major uncertainty is average household size. Presumably, this will continue to trend downwards with increases in income. However, other factors, such as demographics, rents and the desire to work from home following the pandemic, are also relevant.
In principle, it is easy to think of further complications that could be introduced. For example, councils with new rail lines should have higher targets. The value to passengers would be reflected in higher property prices, but not the externality. Considerations like this would be additions to the proposed framework, not substitutes.
The estimates used in assessing local housing shortages are simple and could be made more precise. The estimates compare the average sale price with average construction cost, however these may not be representative if the composition of sales within a local government area differs from the composition of recent building, or if either of these differs from new construction in the area. In practice, both series tend to be highly persistent when samples are large, suggesting these problems are usually not important. However, as noted in footnote 9, sales prices in the Blue Mountains appeared to be an outlier, suggesting room for improvement in data quality. Matched data, using prices and costs for the same dwellings, would provide closer comparisons, though may give rise to sampling variability if samples are small. Site values for land approved for high-density development might provide a convenient alternative.
Data Appendix
Detailed data files are available at https://tinyurl.com/bdf6fwvn
To download the zip file, please copy and paste the url into a new browser window. For further questions regarding the data file, please contactptulip@cis.org.au.
Sale prices are purchased from PropTrack, an affiliate of the popular website www.realestate.com.au. They cover about 39,000 sales in Greater Sydney in 2021/22, representing almost all strata-titled sales, less those designated as ‘townhouse’ or ‘villa’.
There is an argument for restricting the sample to newly constructed apartments. However, the quality of the data on apartment age is not high, the reduction in sample size is large and it does not make a substantial overall difference. Jenner and Tulip (2020, Table A1) restricted their sample to new sales which increased the price in Sydney by 0.5% but reduced their sample size 89%. The reduction in sample size is not a serious problem for metropolitan area estimates but would make estimates for small LGAs unreliable.
Construction cost comes from the ABS Building Approval survey. To reduce volatility, observations are taken from July 2018 through June 2022 and converted to 2021/22 prices by dividing by the change in average apartment construction cost in Greater Sydney. This raises costs at the beginning of the sample by 9%.
No apartments were built in Hawkesbury Local Government Area during the sample period. I proxy construction costs with the average cost in adjoining LGAs.
Most other costs are taken from Jenner and Tulip (2020), where they are explained. This includes costs of marketing and sales (5%), professional fees (3%), finance (7%) and a developer’s margin on structures of 17%. 5% is added for cost overruns based on the average difference in costs between the ABS Building Activity Survey and its Approvals collection. 7% is added for the average difference between marginal and average cost in Sydney, based on Jenner and Tulip, Section 4.2. The product of all those adjustments adds 52% to the Approval Survey cost estimates, and a further flat $20,000 a dwelling is assumed for infrastructure charges.
Most of these add-ons do not vary much by region, so would not affect location decisions. The most arguable exception is infrastructure costs. For private costs, this is relatively straightforward. Local infrastructure contributions, also known as developer contributions or Section 7.11 contributions, are charged by councils when new development occurs. They help fund infrastructure like parks, community facilities, local roads, footpaths, stormwater drainage and traffic management. For most developments, there is a threshold of $20,000 per dwelling. Councils that want to charge more need approval from IPART. However, most approved deviations from the statutory threshold have been less than $30,000 a dwelling.
Publicly provided infrastructure, including schools, hospitals and trunk utilities, is commonly emphasised in discussions of housing location. These costs can be large but they are primarily a function of national population — society will incur them regardless of where people live — so they should not normally be regarded as a social cost in determining location decisions. More importantly, the variation based on location is not large.
The Centre for International Economics (2010) (CIE) estimate public infrastructure costs of about $95,000 per dwelling for a greenfields-oriented strategy versus $84,000 per dwelling for a strategy focussed on infill. The largest reason for the difference is the greater cost of constructing main roads and other transport connections to greenfields areas. AECOM (2018) conducted a similar study for different suburbs within Canberra, though narrower (for example, whereas the CIE included hospitals, AECOM did not). It cost $68,600 per new dwelling to provide infrastructure in the most costly locations (the greenfields suburb of Whitlam), but $9,000 or less in inner suburbs where existing infrastructure had excess capacity. These results seem broadly in line with many of the studies surveyed by SGS (2016), though differences in scope make comparisons difficult.
Two results from these studies seem especially relevant. First, differences in infrastructure costs between different areas are small relative to the variation in prices. Second, costs (especially for transportation) are somewhat lower in central locations than on the suburban fringe.
It is sometimes suggested that the high cost of land makes building new schools in the inner suburbs too costly. However, both the CIE (2010, Table 5) and AECOM (2018 Table 6) estimate the cost of providing schools to be less than $8,000 per dwelling. Even if that were to double or triple, it would not qualitatively change the relationship in charts 2 and 3.
References
AECOM (2018) ‘Greenfield and infill developments in the ACT; A comparative cost study’ https://www.parliament.act.gov.au/__data/assets/pdf_file/0016/1360600/Answer-QToN-5.pdf
Allegretti, Aubrey (2022) ‘Sunak to scrap housebuilding targets after pressure from Tory MPs’ https://www.theguardian.com/politics/2022/dec/05/sunak-backs-down-on-housebuilding-targets-after-pressure-from-tory-mps
Australian Bureau of Statistics (ABS; 2019) ‘Household and Family Projections, Australia’ https://www.abs.gov.au/statistics/people/population/household-and-family-projections-australia/2016-2041#abs-stat-datasets
Breach, Anthony (2022) ‘Can California’s Builder’s Remedy help solve England’s housing crisis?’ https://www.centreforcities.org/blog/can-californias-builders-remedy-help-solve-englands-housing-crisis/
British Columbia, Office of the Premier, 2022; ‘New premier delivers action to expand housing supply within first days’ https://news.gov.bc.ca/releases/2022PREM0065-001745
Caplan, Bryan (2022) ‘No Retirees in My Backyard’ https://betonit.substack.com/p/no-retirees-in-my-backyard
Centre for Independent Studies, (2021) ‘Submission to the Inquiry into Housing Affordability and Supply in Australia’ https://www.cis.org.au/publication/submission-to-the-inquiry-into-housing-affordability-and-supply-in-australia/
Centre for Independent Studies, (2022) ‘The Need for Reform of Land Use Policy; Submission to the Productivity Commission Inquiry into Australia’s Productivity Performance’ https://www.cis.org.au/wp-content/uploads/2022/04/CIS-Submission-on-Housing-to-PC-Productivity-Inquiry.pdf
The Centre for International Economics (CIE) (2010) ‘Costs and benefits of alternative growth paths for Sydney’ https://www.thecie.com.au/publications-archive/costs-and-benefits-of-alternative-growth-paths-for-sydney
Cho, Yunho Shuyun, May Li, and Lawrence Uren (2021) ‘Investment housing tax concessions and welfare: Evidence from Australia’ https://cama.crawford.anu.edu.au/publication/cama-working-paper-series/18248/investment-housing-tax-concessions-and-welfare-evidence
Committee for Sydney (2023) ‘Life in Sydney, 2023’ https://sydney.org.au/wp-content/uploads/2023/02/Committee-for-Sydney-Life-in-Sydney-February-2023.pdf
Commonwealth Productivity Commission (2011) ‘Performance Benchmarking of Australian Business Regulation: Planning, Zoning and Development Assessments’ https://www.pc.gov.au/inquiries/completed/regulation-benchmarking-planning/report/planning-volume1.pdf
Commonwealth Productivity Commission (2022) Housing and Homelessness Agreement Review Study report, https://www.pc.gov.au/inquiries/completed/housing-homelessness/report
Daley, J., Wood, D., and Parsonage, H. 2016, Hot property: negative gearing and capital gains tax reform, Grattan Institute https://grattan.edu.au/wp-content/uploads/2016/04/872-Hot-Property.pdf
Deloitte Access Economics (2019) ‘Analysis of changes to negative gearing and capital gains taxation’ https://secure-web.cisco.com/10UgtYFd1lFj-n4FvPhrsqA4-pWnlG3ivkvR-xgBTDxC9W4C9xXUyfS12dXpL_Wpl5zWvI9YFxqKYC79alF1L3z3Zv9HEfB0COvz7ma7OFWLjY_QfOish2fxgbzS6_ekf4Y9E3w8MwciJZmgcfvZa-dMuynSCbO5S4Hk3gAg6dtlljyHG2lCnK3eGzkqtNkUyL56COiFa5-GOIsVx97k3cwAmEG8HiX8l3-1YkGdDf7s4E4nwhwp-hNJHm7n6A_dK-4Is0mKJLUiKZGEShdjbUgNmCt0mQXUFxUVd3ogmoihNIumkLMQgUs1EIE5Pnj_B/https%3A%2F%2Fcdn2.hubspot.net%2Fhubfs%2F2095495%2F_Communications%2FNGCGT%2FDAE%2520analysis.pdf
Demsas, Jerusalem (2022) ‘Housing Breaks People’s Brains’ https://www.theatlantic.com/ideas/archive/2022/11/us-housing-supply-shortage-crisis-2022/672240/
Devitt, Tom (2023) ‘Labour shortages continue to slow homebuilding’ https://hia.com.au/our-industry/newsroom/economic-research-and-forecasting/2023/01/labour-shortages-continue-to-slow-homebuilding
Distefano Joe and Peter Calthorpe, (2022). ‘Can commercial corridors solve California’s housing crisis?’ https://urbanfootprint.com/blog/policy/ab2011-analysis/
Einstein, Katherine Levine, David M. Glick and Maxwell Palmer (2019) Neighborhood Defenders: Participatory Politics and America’s Housing Crisis https://www.amazon.com.au/Neighborhood-Defenders-Participatory-Politics-Americas/dp/1108477275
Ellis, L (2022) Housing in the Endemic Phase https://www.rba.gov.au/speeches/2022/sp-ag-2022-05-25.html
Galloway, Anthony and Jim Malo ‘More than 70% of young people believe they’ll never be able to buy a home’ https://www.smh.com.au/politics/federal/more-than-70-percent-of-young-people-believe-they-ll-never-be-able-to-buy-a-home-20230223-p5cn01.html
Gamber William; James Graham and Anirudh Yadav (2022) Stuck at home: Housing demand during the COVID-19 pandemic Journal of Housing Economics https://www.sciencedirect.com/science/article/pii/S1051137722000808?via%3Dihub
Glaeser, Edward and Joseph Gyourko (2018) ‘The Economic Implications of Housing Supply’ Journal of Economic Perspectives Vol. 32, No. 1, pp. 3-30
Glaeser, Edward, Joseph Gyourko and Raven Saks (2005), ‘Why is Manhattan so Expensive? Regulation and the Rise in Housing Prices’, The Journal of Law & Economics, 48(2), pp 331–369. https://repository.upenn.edu/cgi/viewcontent.cgi?article=1007&context=penniur_papers
Greater Sydney Commission, (2018) Greater Sydney Region Plan, A Metropolis of Three Cities https://greatercities.au/metropolis-of-three-cities
Greenaway-McGrevy, Ryan (2022) ‘New Zealand’s bipartisan housing reforms offer a model to other countries’ https://www.brookings.edu/blog/the-avenue/2022/01/24/new-zealands-bipartisan-housing-reforms-offer-a-model-to-other-countries/
Gyourko Joseph and Raven Molloy (2015), ‘Regulation and Housing Supply’, Handbook of Regional and Urban Economics, 5, pp 1289–1337. http://www.nber.org/papers/w20536
Hamilton, Emily (2021) ‘Land Use Regulation and Housing Affordability’ Chapter 9 in Regulation and Economic Opportunity: Blueprints for Reform edited by Adam Hoffer and Todd Nesbit https://www.thecgo.org/wp-content/uploads/2021/04/Regulation_and_Economic_Opportunity_Blueprints_for_Reform.pdf
Hughes (2022) ‘Ontario announces ‘bold’ new plan to meet target of building 1.5 million homes’ https://financialpost.com/real-estate/ontario-housing-crisis-plan
Jenner, Keaton and Peter Tulip (2020) ‘The Apartment Shortage’ RBA RDP 2020-04 https://www.rba.gov.au/publications/rdp/2020/2020-04.html
Klein, Ezra (2023) ‘The Story Construction Tells About America’s Economy Is Disturbing’ New York Times https://www.nytimes.com/2023/02/05/opinion/economy-construction-productivity-mystery.html
Lynch, Colin and Kirdan Lees (2021) ‘Cost Benefit Analysis of proposed Medium Density Residential Standards’ https://environment.govt.nz/assets/publications/Cost-benefit-analysis-of-proposed-MDRS-Jan-22.pdf
Moffatt, M., Dudu, A., Hosseini, M. (2022). Ontario’s Need for 1.5 Million More Homes. Smart Prosperity Institute. https://institute.smartprosperity.ca/sites/default/files/Ontario%27s%20Need%20for%201.5m%20More%20Homes-SPI%20August%202022.pdf
Mondragon, John A. and Johannes Wieland (2022) Housing Demand and Remote Work https://www.nber.org/papers/w30041
Murray, Cameron (2020) ‘Marginal and average prices of land lots should not be equal: A critique of Glaeser and Gyourko’s method for identifying residential price effects of town planning regulations’ Environment and Planning A: Economy and Space https://osf.io/fnz7v/
Nall, Clayton and Elmendorf, Christopher S. and Oklobdzija, Stan, Folk Economics and the Persistence of Political Opposition to New Housing (November 2, 2022). Available at SSRN: https://ssrn.com/abstract=4266459 or http://dx.doi.org/10.2139/ssrn.4266459
National Housing Finance and Investment Corporation (NHFIC, 2022) State of the Nation’s Housing 2021–22 https://www.nhfic.gov.au/research/researchreport/state-of-the-nations-housing/state-of-the-nations-housing-2021-22/
NSW Department of Planning and Environment (2023) ‘Forecast insights’ https://www.planning.nsw.gov.au/Research-and-Demography/Sydney-Housing-Supply-Forecast/Forecast-data
NSW Productivity Commission (2021) ‘Rebooting the economy’ https://www.productivity.nsw.gov.au/white-paper
Owens, Darrell, 2023; ‘Bay Area Cities To Lose ALL Housing Zoning Powers in 2 Days’ https://darrellowens.substack.com/p/ca-cities-to-lose-all-zoning-powers
Parliament of Australia (2022) The Australian Dream; Inquiry into housing affordability and supply in Australia, https://parlinfo.aph.gov.au/parlInfo/download/committees/reportrep/024864/toc_pdf/TheAustralianDream.pdf;fileType=application%2Fpdf
Phibbs, Peter and Nicole Gurran (2021) ‘The role and significance of planning in the determination of house prices in Australia: Recent policy debates’ EPA: Economy and Space 2021 53(3) 457-479. https://doi.org/10.1177/0308518X21988942
Saunders, Trent and Peter Tulip (2019) ‘A Model of the Australian Housing Market’ RBA Research Discussion Paper; RDP 2019-01 https://www.rba.gov.au/publications/rdp/2019/2019-01.html
Schneider, Ben (2022) ‘Inside California’s Quiet Housing Policy Revolution’ https://www.sfexaminer.com/news/california-housing-laws-to-bring-new-homes-to-sf/article_ef5670c4-5973-11ed-890f-73259491abec.html
Schuetz, Jenny (2022a) Fixer-Upper; Brookings Institute; https://www.brookings.edu/book/fixer-upper/
Schuetz, Jenny (2022b) Are new housing policy reforms working? We need better research to find out. https://www.brookings.edu/blog/the-avenue/2022/11/21/are-new-housing-policy-reforms-working-we-need-better-research-to-find-out/
SGS Economics and Planning (2016) ‘Comparative costs of urban development: a literature review’ https://www.infrastructurevictoria.com.au/wp-content/uploads/2019/04/SGS-Economics-and-Planning-Comparative-costs-of-infrastructure-across-different-development-settings.pdf
Smith, Stanley K (1986) A Review and Evaluation of the Housing Unit Method of Population Estimation; Journal of the American Statistical Association 81(394):287-96
Stevens, Glenn (2017) Housing Affordability; Report to the Premier of NSW https://www.nsw.gov.au/sites/default/files/2020-04/housing-affordability-report-to-premier.pdf
Thompson, Angus (2020) ‘Planning Minister warns of ‘direct action’ against north shore council over housing targets’ https://www.smh.com.au/national/nsw/planning-minister-warns-of-direct-action-against-north-shore-council-over-housing-targets-20200929-p5608f.html
Tulip, Peter (2020) ‘Planning restrictions harm housing affordability’ https://www.cis.org.au/publications/policy-papers/planning-restrictions-harm-housing-affordability/
Tulip, Peter (2021) ‘Misunderstandings about Planning Restrictions’ http://petertulip.com/misunderstandings.pdf
Tunny, Gene (2018) ‘Untangling the Debate Over Negative Gearing’ Policy Vol. 34 No. 1, Autumn 2018 https://www.cis.org.au/app/uploads/2018/03/34-1-tunny-gene.pdf
Acknowledgements
Thanks to Anna Bardsley, Stephanie Barker, Tom Carr, Simon Cowan, Keaton Jenner, Paul Ryan and seminar participants at the NSW Treasury and Urban Taskforce for helpful comments and discussions.
The author can be contacted at ptulip@cis.org.au
Notes
[1] The data series, ‘Residential – New Secondary Occupancy’ is available from https://pp.planningportal.nsw.gov.au/local-development-performance-monitoring-ldpm
[2] For England see UK Department for Communities and Local Government (2017); for California, see Schneider (2022); For British Columbia, Office of the Premier (2022); For Ontario, see Hughes (2022) or Moffatt et al (2022).
[3] ABS estimates of Greater Sydney include the Central Coast whereas DPE and GCC estimates do not. For comparability, I use the DPE and GCC definition in Tables and other calculations, though for comparability with ABS estimates I include the central coast as a memo item in tables. Where ‘Greater Sydney’ estimates are obtained from the ABS, I recalculate to exclude the Central Coast.
[4] This approach is sometimes described as the ‘Housing Unit Method’; however, as discussed by Smith (1986), that method estimates population from housing, rather than the converse.
[5] A more sophisticated version of the demographic approach is suggested by Moffatt et al (2022), who design local targets for Ontario. They infer unconstrained household size from provinces with unconstrained housing markets. This approach avoids some, but not all, of the problems discussed in the text. However, finding a representative guide to unconstrained household size is difficult.
[6] Jenner and Tulip, using different data for 2018, also estimated excess demand of 41% of the price.
[7] The formula for targets is described in UK Department of Levelling Up, Housing and Communities (2019).
[8] To be precise, these are the proportions of the total of houses, townhouses, terraces and apartments – excluding caravans, houseboats and other tiny categories.
[9] Charts 2 and 3 do not show the outlier of the Blue Mountains, which had under-pricing of 24% and dwelling growth of 3%. There are some anomalous features of this observation which possibly arise from an unrepresentative sample. The price estimate for the Blue Mountains is the average of only 71 sales, the third smallest sample in the data.
[10] As an analogy, demand for vanilla ice-cream is much greater than for grapefruit-flavoured ice-cream; However their prices are similar, because supply increases to meet the extra demand.
[11] The data appendix for Jenner and Tulip (2020) gives the cost of land, inclusive of structure, for detached houses on an SA3 basis, which sometimes coincides with LGAs. This is most expensive in Sydney ($10,514/sqm) and Woollahra and Waverly ($9, 055/sqm) LGAs. The cost of purchasing typical detached housing in these areas to build typical apartments, each requiring 20sqm of land on average (Jenner and Tulip, Section 6.1) would be about $200,000 per apartment. This would be offset by obviating the need to increase construction costs with taller buildings, reducing the marginal cost of supply by 7% or about $70,000 on average in Waverly and Woollahra. The cost of buying and replacing detached housing in middle ring areas (Ku-ring-gai, Canterbury, Auburn) with the same building would be about $50,000 per apartment and in outer areas (Liverpool, Blacktown, Penrith, Campbelltown, etc) about $25,000 per apartment.
[12] Initial GSC targets are available at https://greatercities.au/strategic-planning/monitoring-the-plans/local-planning-assurance-tracker. Council and DPE approvals are at https://www.planningportal.nsw.gov.au/local-housing-strategies-tracker. I am indebted to Chris O’Dell of Gyde Consulting for the pointers and for compiling the data.
[13] The exception is Blacktown, which may reflect data anomalies. The target in Table 4 is based on Census estimates that 23,081 dwellings were added to Blacktown between 2016 and 2021 (20,831 of which were detached houses). In contrast, GCC targets are based on DPE estimates that only 17,761 dwellings were completed in this period. This is by far the largest discrepancy between the series.